

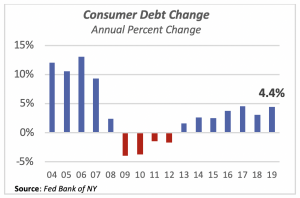
Consumer Debt Continues to Climb
Total consumer debt reached $14.2 trillion in the fourth quarter of last year, a 4.4% increase from the prior year, when it was $13.5 trillion. Consumer debt has been increasing for seven years now, following the collapse in debt brought about by the 2007-2009 recession. Of course, that recession was a necessary readjustment in consumer finances, and credit markets in general, after irresponsible borrowing and lending tied to the housing markets led to millions of foreclosures.
While consumer debt grew 75% in the period from 2003 to 2008, at an average of 15% annually, the total increase since 2009 has been 16%, or 1.6% per year. More importantly, and burdensome, is that over the last decade, student and auto lending are driving the increases. Student debt has more than doubled (up 109%) since 2009, and auto loans are up 84%. The chart below displays the changes in debt by source between these two periods.
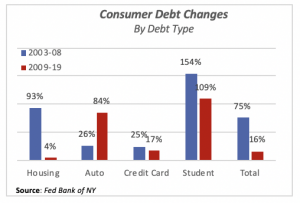
Student debt growth dwarfs all other debt types in both periods. Also, while housing debt nearly doubled in the early 2003-08 period (up 93%) it has grown very little overall since 2009. The low growth is because housing debt continued to contract faster in the immediate years after the recession.
Auto loans have also increased rapidly since 2009, but as we know, the principal difference between automobile and student loans lies in cases of non-payment or default on the loan. In the case of a default on an auto loan, the borrower loses the collateral — the automobile — and ends up with a bad credit rating for a few years.
But in the case of student loans, there is no collateral other than the student’s future income. And there is no legal way of disavowing the debt burden; default is not an option. Student debt is a lifetime burden for many borrowers.
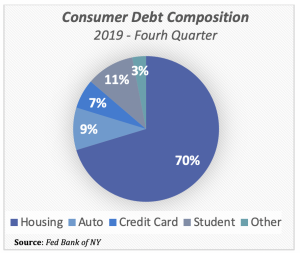
The largest component of consumer debt is housing, including both home purchase loans as well as home equity loans, which account for 70% of total consumer debt. Second largest debt component is student loans, accounting for 11% of debt dollars. Student debt will continue to hamper the economic and financial condition of many consumers for years to come.
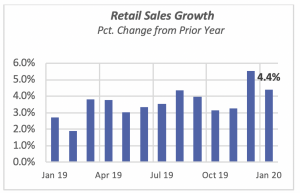
Retail Sales Rise
Total retail sales increased 0.3% in January to reach $529 billion in the month, capping four consecutive months of gains in retail sales. On an annual basis, sales were 4.4% above January 2019; except for the 5.5% gain in December, last month’s sales growth was the highest since August 2019.
The biggest contributors to total sales were those at Vehicle & Auto Parts retailers, accounting for one in five retail sales. Although vehicles have been roughly 20% of total retail sales over the last decade, their current share is lower than the 25% maintained through most of the 1990s. The lower prominence of autos in consumer spending reflects in part the greater durability of today’s automobiles — consumers can drive their cars longer — and also the apparent preference by younger consumers toward other types of transportation, such as Uber or Lyft.
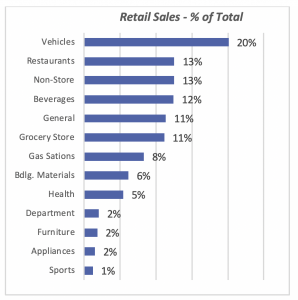
Sales at Building Materials stores represent 6% of total retail sales, although this figure does not reflect the overall importance of building materials to the U.S. economy. A large volume is sold business- to-business, so perhaps a majority of building materials sales are reflected in wholesale transactions, not retail. Additionally, another portion of building materials are sold directly by manufacturers to builders or contractors, and thus are not recorded among retail sales.
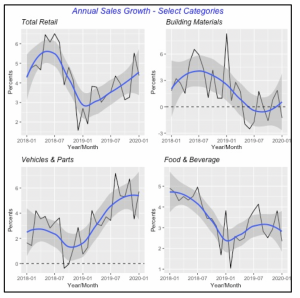
But within the retail sector, sales at building materials stores fell 1.3% in January, compared to a year ago; it is one of the few categories where sales fell in January.
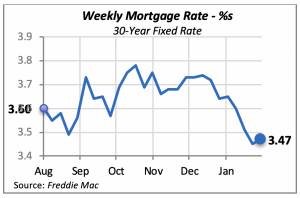
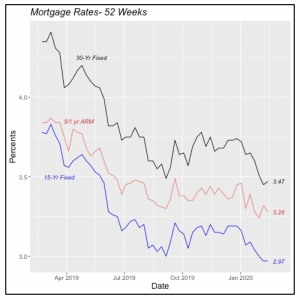
Mortgage Rates Edge Up
Last week, the 30-year fixed mortgage rate moved up two basis points to 3.47%. It still remains at a very favorable rate for home purchases and home equity loans. It still hovers in a historically low range, comparable only to the rates seen six years ago.
Although the various types of mortgage rates tend to follow a similar pattern generally, they do not necessarily follow identical paths. This is because borrowers might have different preferences over time, sometimes favoring fixed mortgage rates and at others, moving toward adjustable-rate mortgages.
Manuel Gutierrez, Consulting Economist to NKBA
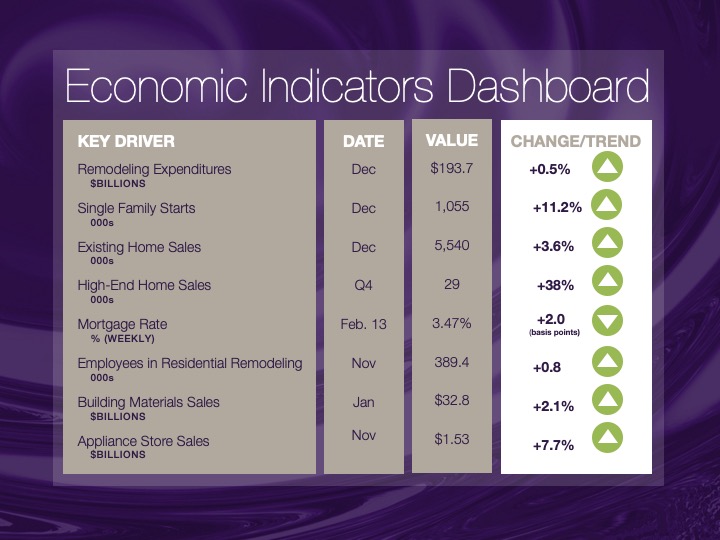
Explanation of NKBA’s Economic Indicators Dashboard
The dashboard displays the latest value of each economic indicator with a colored triangle that highlights visually the recent trend for each of the drivers. “Green” is a positive signal, indicating that the latest value is improving; “Yellow,” as it’s commonly understood, denotes caution because the variable may be changing direction; “Red” indicates that the variable in question is declining, both in its current value and in relation to the recent past.
Note that all the data, except for “mortgage rate” and “appliance-store sales” are seasonally adjusted and are represented at annual rates.
Remodeling Expenditures. This is the amount of money spent on home improvement projects during the month in question. It covers all work done for privately owned homes (excludes rentals, etc.). The data are in billions of dollars and are issued monthly by the U.S. Department of Commerce.
Single-Family Starts. This is the number of single-family houses for which construction was started in the given month. The data are in thousands of houses and are issued monthly by the U.S. Department of Commerce.
Existing-Home Sales. These data are issued monthly by the National Association of Realtors and capture the number of existing homes that were sold in the previous month.
High-End Home Sales. This series are sales of new homes priced at $500,000 and higher. The data are released quarterly by the U.S. Department of Commerce and are not seasonally adjusted. Thus, a valid comparison is made to the same quarter of prior year.
Mortgage Rate. We have chosen the rate on 30-year conventional loans that is issued by the Federal Home Loan Mortgage Corporation (known popularly as Freddie Mac.) Although there are a large number of mortgage instruments available to consumers, this one is still the most commonly used.
Employees in Residential Remodeling. This indicator denotes the number of individuals employed in construction firms that do mostly residential remodeling work.
Building-Materials Sales. These data, released monthly by the Department of Commerce, capture total sales of building materials, regardless of whether consumers or contractors purchased them. However, we should caution that the data also includes sales to projects other than residential houses.
Appliance-Store Sales. This driver captures the monthly sales of stores that sell mostly household appliances; the data are stated at an annual rate. We should not confuse this driver with total appliance sales, since they are sold by other types of stores such as home centers.
We hope you find this dashboard useful as a general guide to the state of our industry. Please contact us at Feedback@nkba.org if you would like to see further detail.


