

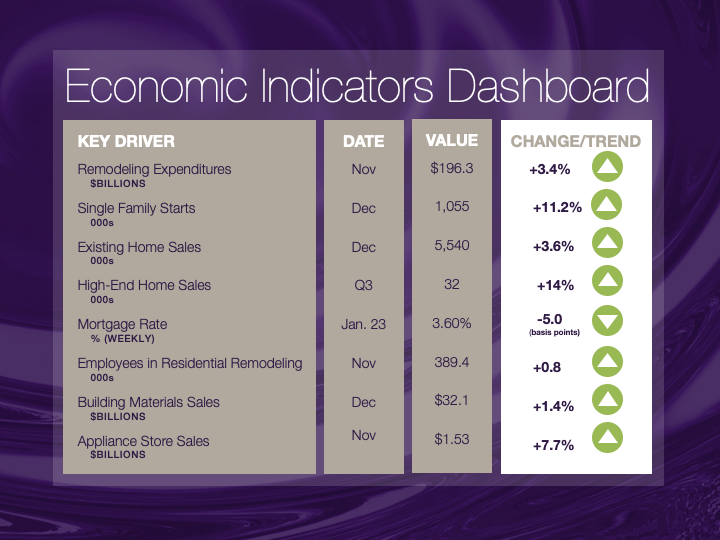
Sales of Existing Homes Spike
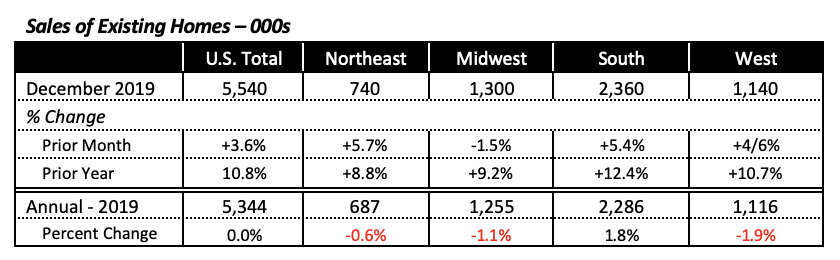
Sales of existing homes jumped by a welcome 3.6% in December to reach an annualized rate of 5.54 million units. This is the highest pace in nearly two years, since the rate of 5.61 million units reached in February 2018.
As seen in the chart below, sales of existing homes generally exhibited a positive trend throughout last year, despite monthly fluctuations. Compared to a year before, home sales were 10.8% higher than they were in December 2018.
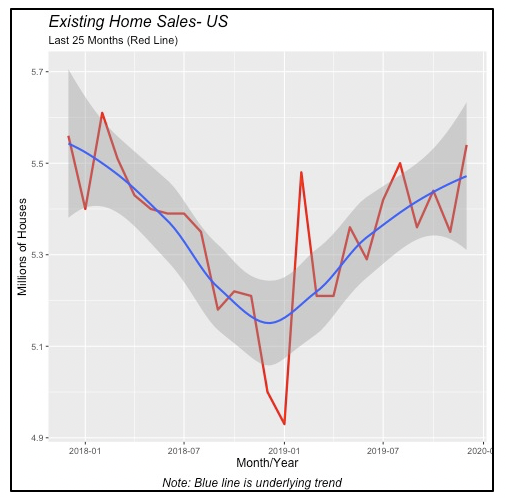
But on an annual basis, the number of homes sold in 2019 was even with 2018’s total; that is, for the full year, a total of 5.34 million existing houses were sold. Home sales for both years, 2018 and 2019, were 3.1% lower than in 2017.
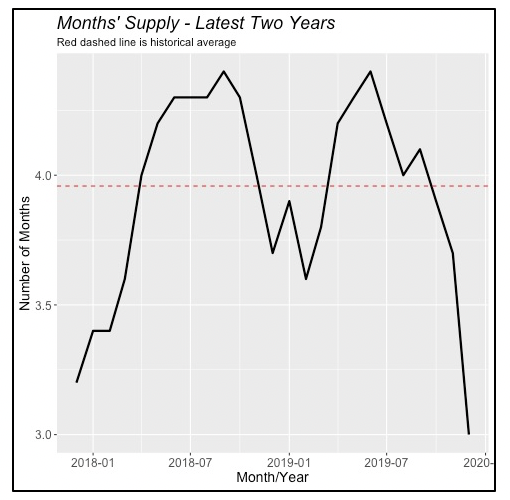
Despite the gains over the last few months, the generally lackluster performance in home sales is attributable in part to the low inventory of houses on the market. There are currently 1.4 million homes for sale, including condominium units, with 1.2 million single-family houses. There were 9% fewer single-family homes for sale in December 2019 than there were a year before.
The current low inventory can sustain only three months of sales at the current pace. This, as shown in the chart below, is lower than the average of near four months inventory in the previous two years.
Regionally, three of the four U.S. regions saw home sales increase in December; the only exception was the Midwest, which posted a 1.5% drop in home sales. The other three regions saw sales increases of around 5% from the previous month.
But compared to a year before, home sales in all four regions exceeded December 2018 by double-digits; again, except in the Midwest, where sales were just under 10% higher.
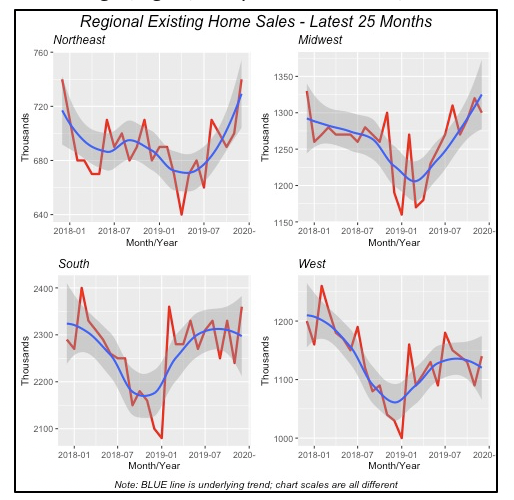
Despite last month’s gains, the general trend is not strongly positive in all four regions. Home sales in the Northeast and the Midwest have increased more or less steadily over the last years, however, sales in the South and the West were relatively flat over the last year, following a substantial jump in sales in January 2019, as seen in the chart above.
Employment: Worker Shortages Persist
As has been well-documented, labor shortages persist in the U.S., even though there is a relatively large number of unemployed workers who could fill those jobs. The number of job openings has been increasing steadily over the last decade, even as the economy continued to absorb more and more workers. Since 2010, U.S. employers have added an average of 2.3 million jobs per year, and the number of unemployed persons has fallen from more than 15 million in 2010 (a high number after the Great Recession of 2007-2009) to 5.8 million last year.
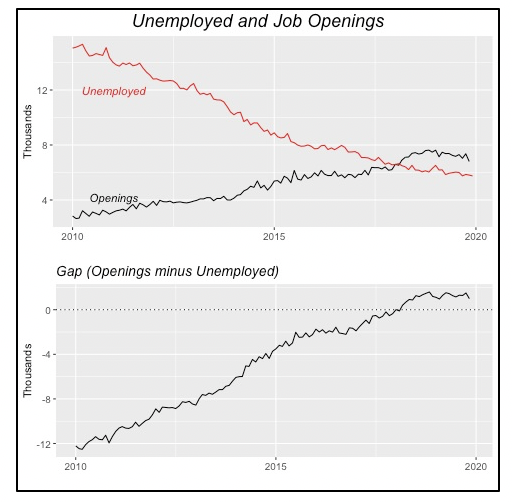
But employers still need more workers, thus the increasing number of openings. As of last November, there were 6.8 million job openings — nearly a million more than the number of unemployed workers. The number of openings declined last year by more than 800,000 jobs, across most industries.
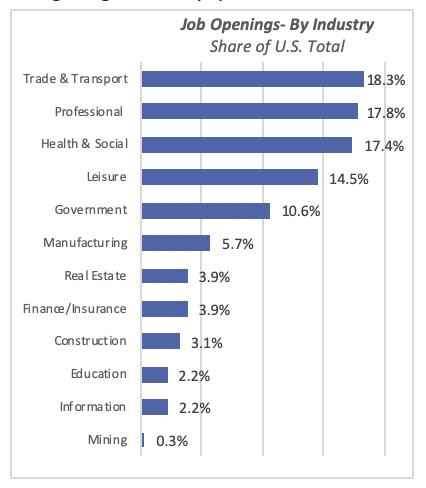
Only three sectors saw an increase in openings in 2019: Information (i.e. computers, software), Education and Government. The last two are almost independent from current economic conditions.
The areas with the largest declines were Manufacturing and Trade & Transportation — both are more heavily impacted by trade issues.
The gap between openings and the number of unemployed workers (shown in the lower panel of the chart above), doesn’t imply that all those unemployed workers can get a job. There are a variety of reasons why some of the unemployed cannot find work — obvious ones include a skills mismatch, where job-seekers don’t have the required skills for positions available; location is another reason, as the jobs may be in different cities from where workers currently live.
In fact, the top three areas with most job openings, which jointly account for more than half of the U.S. total, may require special skillsets. This is particularly true in two of these areas — Professional Services and Health & Social Services — where most jobs very likely require a college degree in very specific areas.
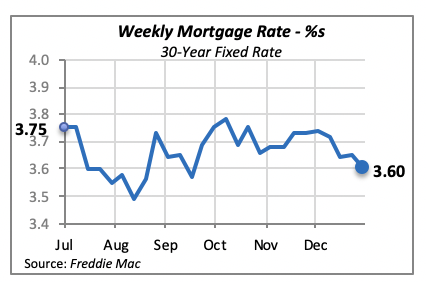
Another Modest Drop for Mortgage Rates
Mortgage rates edged slightly down last week, by 5 basis points to 3.6% for the 30-year fixed rate. Mortgage rates have fluctuated within the 3.5%-to-3.8% range over the last six months, which should not significantly impact consumers’ decisions to purchase a home or remodel their existing home.
Manuel Gutierrez, Consulting Economist to NKBA
Explanation of NKBA’s Economic Indicators Dashboard
The dashboard displays the latest value of each economic indicator with a colored triangle that highlights visually the recent trend for each of the drivers. “Green” is a positive signal, indicating that the latest value is improving; “Yellow,” as it’s commonly understood, denotes caution because the variable may be changing direction; “Red” indicates that the variable in question is declining, both in its current value and in relation to the recent past.
Note that all the data, except for “mortgage rate” and “appliance-store sales” are seasonally adjusted and are represented at annual rates.
Remodeling Expenditures. This is the amount of money spent on home improvement projects during the month in question. It covers all work done for privately owned homes (excludes rentals, etc.). The data are in billions of dollars and are issued monthly by the U.S. Department of Commerce.
Single-Family Starts. This is the number of single-family houses for which construction was started in the given month. The data are in thousands of houses and are issued monthly by the U.S. Department of Commerce.
Existing-Home Sales. These data are issued monthly by the National Association of Realtors and capture the number of existing homes that were sold in the previous month.
High-End Home Sales. This series are sales of new homes priced at $500,000 and higher. The data are released quarterly by the U.S. Department of Commerce and are not seasonally adjusted. Thus, a valid comparison is made to the same quarter of prior year.
Mortgage Rate. We have chosen the rate on 30-year conventional loans that is issued by the Federal Home Loan Mortgage Corporation (known popularly as Freddie Mac.) Although there are a large number of mortgage instruments available to consumers, this one is still the most commonly used.
Employees in Residential Remodeling. This indicator denotes the number of individuals employed in construction firms that do mostly residential remodeling work.
Building-Materials Sales. These data, released monthly by the Department of Commerce, capture total sales of building materials, regardless of whether consumers or contractors purchased them. However, we should caution that the data also includes sales to projects other than residential houses.
Appliance-Store Sales. This driver captures the monthly sales of stores that sell mostly household appliances; the data are stated at an annual rate. We should not confuse this driver with total appliance sales, since they are sold by other types of stores such as home centers.
We hope you find this dashboard useful as a general guide to the state of our industry. Please contact us at Feedback@nkba.org if you would like to see further detail.


