

Inflation Remains Below 2%
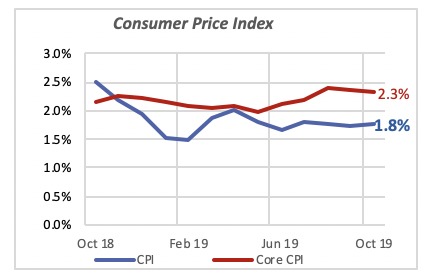
October’s report on consumer prices revealed that overall inflation rose modestly, by 0.1%, to 1.8%. This shows that inflation has remained stable within a 0.1% range over the past six months.
The Consumer Price Index (CPI) attempts to measure the overall change in consumer prices by including products that consumers typically buy. But two of these product categories, food and energy, tend to be very volatile and fluctuate from month to month, often depending on such vagaries as the weather or geopolitical events. Thus, an alternative measure of inflation is calculated excluding these two items; this measure is commonly referred to as “core” inflation. Economists generally believe that it captures better the underlying pattern and trend in consumer prices.
Core inflation, in contrast, fell by 0.1% in October to 2.3%. The fact that the core inflation rate has been higher than the overall CPI over the last year reflects the fact that energy prices, particularly gasoline, have been falling rapidly over the last year.
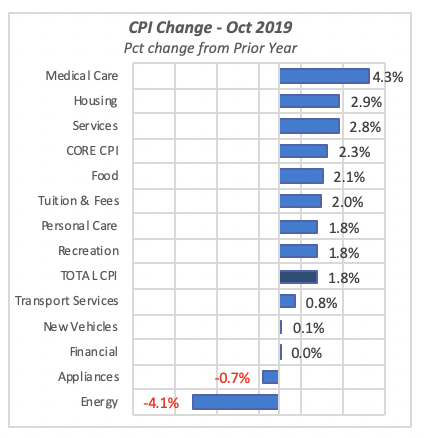
There is a difference in the rate of inflation among all the product categories that make up the CPI — as there should be. Prices of individual products will rise or fall depending on consumer demand for those products, and consumer tastes and preferences change frequently. Of course, the supply and availability of those products also influences their price.
The chart below, which displays the change in prices over the last year for a number of key product categories, highlights these differences. Price changes over the 12 months ended in October ranged from a 4.1% decline for Energy products; gasoline prices not depicted in the chart are 7.3% below last year. At the top end, that prices for Medical Care led with a 4.3% overall increase.
Interestingly, the main driver of the rising costs for medical care is not medical drugs and other products used by the medical profession but, rather, medical services. Drugs and other medical products, labeled as “Medical Commodities” in the lower-left graph in the chart below, have risen only 1% over the 12 months ended in October (note that three of the graphs display data for the latest 25 months ended in October of this year). The chart with the green line shows that medical commodities inflation has remained below 1% for most of this year.
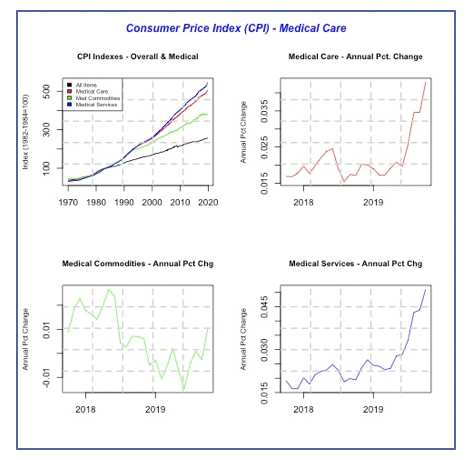
In contrast, the prices of Medical Services such as doctor visits, hospital stays, etc. have been rising rapidly this year to reach 5.1% in October. That is, currently medical services prices are more than 5% higher than they were a year ago.
Federal Budget Deficit and National Debt Worsen
From time to time, we are reminded that the federal government’s budget deficit is getting worse and the total U.S. government debt is too high. That is, the federal government is spending more money that is taking in, and those deficits increase the total debt, year after year.
In fact, the nation’s history over the last 50 years, since the early 1970s, has been one of profligate spending by the Federal government. There was only a short period of time between 1999 and 2002 when the government posted surpluses; this is marked in the chart when the blue line of “receipts” is above the red “spending” line.
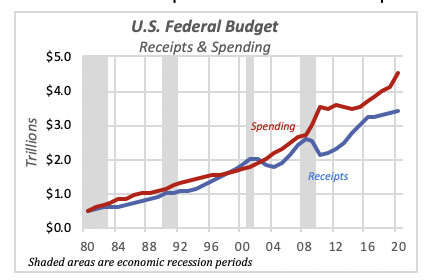
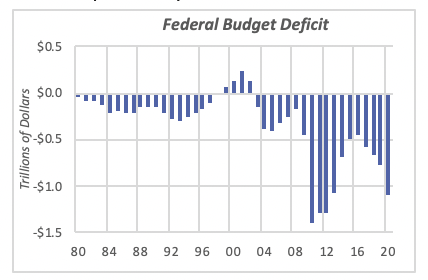
While traditionally, the government’s fiscal situation would deteriorate during and in the aftermath of economic recessions, the last few years of relative economic stability have still resulted in larger and greater budget deficits. These larger deficits are the result of spending rising three times faster than revenues. For the 2020 budget — that is, the current fiscal year — revenues are projected to increase by 3%, or $108 billion. But at the same time, expenditures are rising by 10%, or $400 billion.
The deficit for the current fiscal year, Oct. 1, 2019, through Sept. 30, 2020, is projected to exceed $1 trillion. This is a figure surpassed only by the three years immediately after the 2007-2009 recession, when government receipts dropped substantially, while expenses rose faster than the previous years.
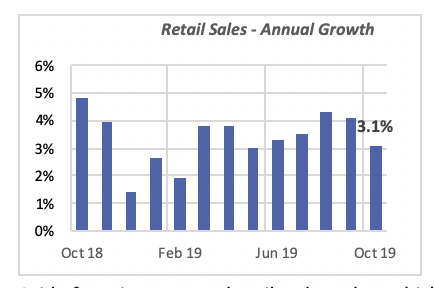
Retail Sales Rise, Erasing September Slide
October retail sales increased by 0.3% in October, to reach nearly $527 billion for the month. This cancels the previous month’s decline of a similar percentage. Compared to last year, retail sales are running at a slightly lower pace than the preceding four months, clocking a 3.1% growth for October.
Even though annual sales growth in October trails that of the previous two months, overall retail sales have had monthly increases above 3% virtually throughout this year, except for the months of January and February (which are typically slow months, following the holiday sales period).
Aside from internet and mail order sales, which jumped 14% in October to $70 billion for the month, sales at Restaurants & Bars rose by 4.7% to $65 billion in October.
Sales of the all-important Vehicles and Parts category, which accounts for 20% of retail sales, rose by 4.5% in October (rounded to 4% in the chart).
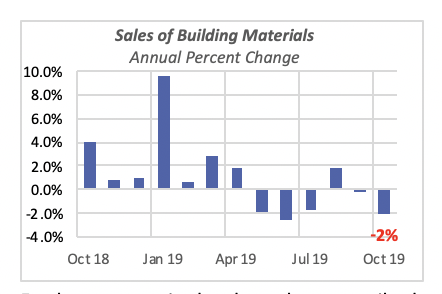
Closer to our industry, sales of Building Materials fell by 2% in October, to just $31.4 billion. Retail sales of building materials represent only 6% of total retail sales. Once it is noted that a large portion of building materials are purchased either from wholesalers or directly from manufacturers, this data is obviously not included under general retail sales.
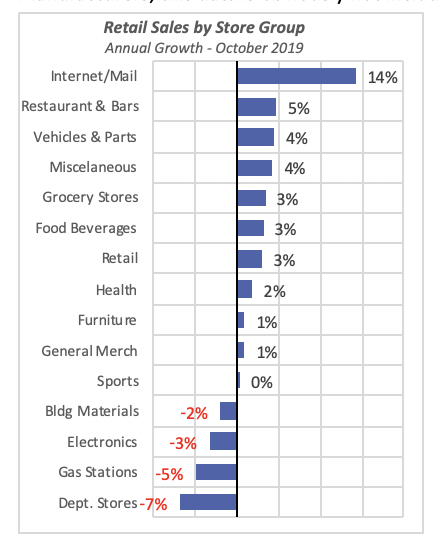
Other declining categories are Department Stores sales, which fell by 7% for the month. As is well known, sales at traditional brick-and-mortar Department Stores have been declining rapidly since the rise of internet sellers like Amazon. In fact, year-to-date sales at brick-and-mortar stores have fallen every year since 2001, with the exception of 2005, when inexplicably they rose by a modest 0.3%.
Building Materials Sales Fall
As mentioned above, sales at Building Materials stores fell by 2% in October; this follows a virtually flat September, when sales had dropped by a nearly negligible 0.2%.
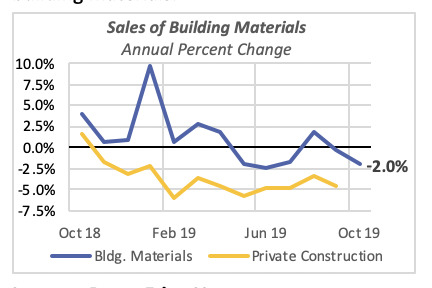
Further, as seen in the chart above, retail sales of Building Materials have fallen in five of the last six months. This is not surprising, given that private construction spending has been falling for the last 12 months.
The chart below shows the declining trend for both construction spending and retail sales of building materials.
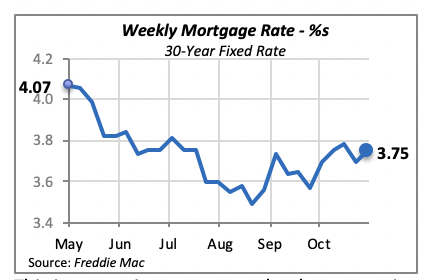
Interest Rates Edge Up
The 30-year fixed mortgage rate moved up slightly last week, by six basis points. This increase puts the rate at its second-highest level since early July, despite the Fed’s moves to lower interest rates.
This increase is not expected to have a noticeable impact on home sales or home construction. In fact, sales and construction today are very likely based on mortgage rates of a month or so ago, since it takes times to complete the paperwork to close on a mortgage loan.
Manuel Gutierrez, Consulting Economist to NKBA
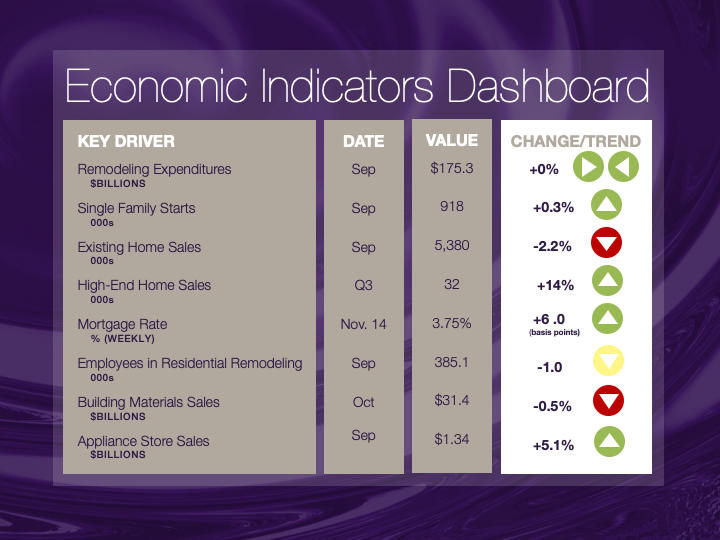
Explanation of NKBA’s Economic Indicators Dashboard
The dashboard displays the latest value of each economic indicator with a colored triangle that highlights visually the recent trend for each of the drivers. “Green” is a positive signal, indicating that the latest value is improving; “Yellow,” as it’s commonly understood, denotes caution because the variable may be changing direction; “Red” indicates that the variable in question is declining, both in its current value and in relation to the recent past.
Note that all the data, except for “mortgage rate” and “appliance-store sales” are seasonally adjusted and are represented at annual rates.
Remodeling Expenditures. This is the amount of money spent on home improvement projects during the month in question. It covers all work done for privately owned homes (excludes rentals, etc.). The data are in billions of dollars and are issued monthly by the U.S. Department of Commerce.
Single-Family Starts. This is the number of single-family houses for which construction was started in the given month. The data are in thousands of houses and are issued monthly by the U.S. Department of Commerce.
Existing-Home Sales. These data are issued monthly by the National Association of Realtors and capture the number of existing homes that were sold in the previous month.
High-End Home Sales. This series are sales of new homes priced at $500,000 and higher. The data are released quarterly by the U.S. Department of Commerce and are not seasonally adjusted. Thus, a valid comparison is made to the same quarter of prior year.
Mortgage Rate. We have chosen the rate on 30-year conventional loans that is issued by the Federal Home Loan Mortgage Corporation (known popularly as Freddie Mac.) Although there are a large number of mortgage instruments available to consumers, this one is still the most commonly used.
Employees in Residential Remodeling. This indicator denotes the number of individuals employed in construction firms that do mostly residential remodeling work.
Building-Materials Sales. These data, released monthly by the Department of Commerce, capture total sales of building materials, regardless of whether consumers or contractors purchased them. However, we should caution that the data also includes sales to projects other than residential houses.
Appliance-Store Sales. This driver captures the monthly sales of stores that sell mostly household appliances; the data are stated at an annual rate. We should not confuse this driver with total appliance sales, since they are sold by other types of stores such as home centers.
We hope you find this dashboard useful as a general guide to the state of our industry. Please contact us at Feedback@nkba.org if you would like to see further detail.


