

Construction Markets Remain Flat
Expenditures for private construction projects, both residential and non-residential, was virtually flat in August at an annual rate of $955 billion, perhaps stalling — momentarily — the more or less continuous decline in construction spending over the last year. In fact, except for a modest upswing at the beginning of this year, total private construction has been steadily falling since mid-2018.
Last month’s spending was helped by a 0.9% increase in residential construction, but offset by a 1% drop in non-residential construction.
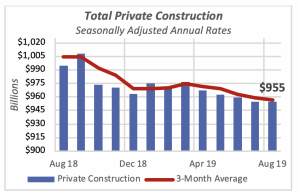
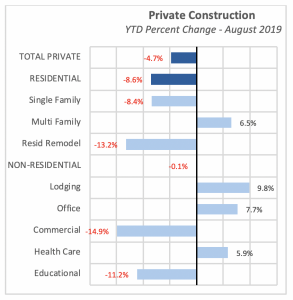
Private construction clocked in at 4% below last year, when construction spending was running at an annual rate of $995 billion. Further, both residential and non-residential spending is lagging the pace seen in August 2018.
Year-to-date through August, spending is just under 5% below the comparable period last year. But while year-to-date residential construction is nearly 9% below last year, non-residential is only 0.1% lower.
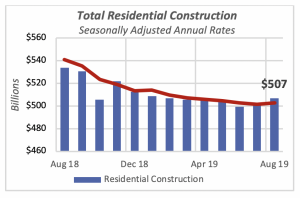
Spending for residential projects rose by 0.9% in August, following a smaller 0.6% rise the previous month, to reach an annual rate of $507 billion. Despite these modest gains, spending is still 5% below last year.
Moreover, year-to-date residential spending is 8.6% lower than last year. Were it not for the fact that multifamily construction is up by 6.5% from last year, total residential would be much lower. This is because the other two residential components — single-family housing and homeowner remodeling — are each down year-to-date by 8.4% and 13.2%, respectively.
Year-to-date construction for non-residential projects through August is virtually the same (down 0.1% this year) as in the comparable period last year it is actually down this year.
Within the residential sector, construction of single-family houses and remodeling are driving the overall total. Multifamily construction, as indicated by housing-starts data, shows that the number of new multifamily units is modestly higher than last year: year-to-date is up 0.3%.
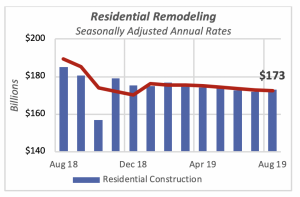
But in an area of great interest to our members — residential remodeling — the construction data reveals that this sector is slipping slightly, as illustrated in the chart below. Remodeling dollar volume is off by a little less than 1% since January, but it has dipped every month in 2019.
Employment Still at 50-Year High, but Growth Slows
The September employment report brought mixed news. On the positive side, businesses and the government added workers in the month: 114,000 were added by the private sector and 22,000 by the government, for a total of 136,000 new jobs. But this is the lowest number of new jobs created over the last four months.
The labor participation rate was unchanged in the month, at 63.2%. Hourly wages were increasing by 3.5% in September, slightly below the 3.6% scored in August, but within the range they have maintained since the beginning of the year.
The unemployment rate fell further, to 3.5%, dropping for all race, ethnic and age groups, and, once again, it’s the lowest jobless rate in more than 50 years.
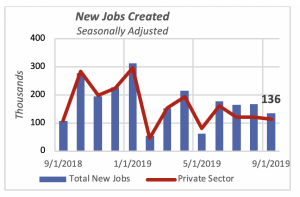
While year-to-date through September, 1.45 million jobs have been created, it’s still lower than the 1.98 million that were created over the same period last year. The U.S. economy is apparently winding down, a process probably accelerated by trade disputes with China, India and possibly with the European Union. These issues all have had a negative impact, especially on manufacturing and agriculture.
Nonetheless, Professional & Business Servicesand Health Carelead the growth, generating over 40% of the new jobs. All three levels of government have jointly added 156,000 jobs — more than 10% of the total. Most of the government jobs, however, originate at the local level; that is, cities and towns are generating more than the Federal and State governments combined. Federal employment is expected to increase substantially over the next few months, as previously reported, since the government will need several hundred thousand temporary workers to conduct the 2020 Census.
Growth in manufacturing jobs, which were the hope of a revival in the U.S., has begun to wind down. Year-to-date, 41,000 manufacturing jobs have been created, which is significantly fewer jobs than the 188,000 created in the same period last year. The decline in manufacturing is corroborated by shipments from manufacturers, which every month so far in 2019 have been showing smaller gains over last year. Moreover, monthly shipments dropped in July and August, and with the decline in April, that makes it three of the last five months.
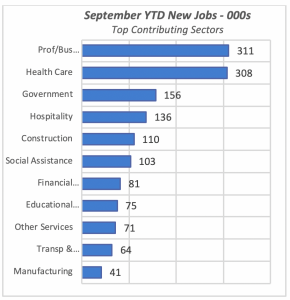
Not shown in the chart are three sectors with year-to-date job losses. Leading with the most losses is Retail Trade, where employment has shrunk by 78,000 so far this year. Mining and Utilities are the other two categories, with joint losses of 11,000 jobs.
Mortgage Rates Remain Stable
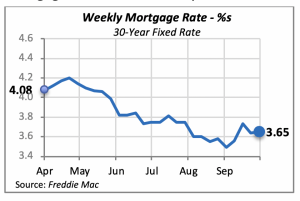
The 30-year fixed mortgage rated remained virtually unchanged last week, rising only one basis point to 3.65%. Naturally, such a minuscule change is not going to influence borrowing, given that residential construction and sales have been relatively unaffected by the 1% drop in mortgage rates over the last year or so.
Manuel Gutierrez, Consulting Economist to NKBA
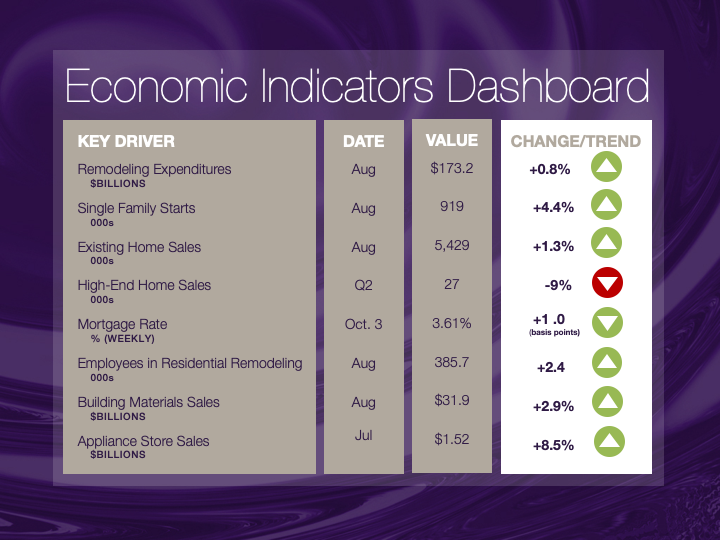
Explanation of NKBA’s Economic Indicators Dashboard
The dashboard displays the latest value of each economic indicator with a colored triangle that highlights visually the recent trend for each of the drivers. “Green” is a positive signal, indicating that the latest value is improving; “Yellow,” as it’s commonly understood, denotes caution because the variable may be changing direction; “Red” indicates that the variable in question is declining, both in its current value and in relation to the recent past.
Note that all the data, except for “mortgage rate” and “appliance-store sales” are seasonally adjusted and are represented at annual rates.
Remodeling Expenditures. This is the amount of money spent on home improvement projects during the month in question. It covers all work done for privately owned homes (excludes rentals, etc.). The data are in billions of dollars and are issued monthly by the U.S. Department of Commerce.
Single-Family Starts. This is the number of single-family houses for which construction was started in the given month. The data are in thousands of houses and are issued monthly by the U.S. Department of Commerce.
Existing-Home Sales. These data are issued monthly by the National Association of Realtors and capture the number of existing homes that were sold in the previous month.
High-End Home Sales. This series are sales of new homes priced at $500,000 and higher. The data are released quarterly by the U.S. Department of Commerce and are not seasonally adjusted. Thus, a valid comparison is made to the same quarter of prior year.
Mortgage Rate. We have chosen the rate on 30-year conventional loans that is issued by the Federal Home Loan Mortgage Corporation (known popularly as Freddie Mac.) Although there are a large number of mortgage instruments available to consumers, this one is still the most commonly used.
Employees in Residential Remodeling. This indicator denotes the number of individuals employed in construction firms that do mostly residential remodeling work.
Building-Materials Sales. These data, released monthly by the Department of Commerce, capture total sales of building materials, regardless of whether consumers or contractors purchased them. However, we should caution that the data also includes sales to projects other than residential houses.
Appliance-Store Sales.This driver captures the monthly sales of stores that sell mostly household appliances; the data are stated at an annual rate. We should not confuse this driver with total appliance sales, since they are sold by other types of stores such as home centers.
We hope you find this dashboard useful as a general guide to the state of our industry. Please contact us at Feedback@nkba.orgif you would like to see further detail.


