

Employment Picture Assuages Concerns
Total U.S. employment rebounded sharply last month with 224,000 new jobs, a welcome report following poor job growth in May. Further, the May figure for job creation was revised upward by 20,000 to 72,000. June’s gain, aided by the May revision, relieve concerns of a possible slowdown of the U.S. economy.
Despite this gain, the low job number in February and May brings the year-to-date through June total to only just over 1 million new jobs. This compares poorly with the same period last year, when 1.4 million jobs were created. That is, so far this year, private and government employers have hired 27% fewer people than in the same period last year.
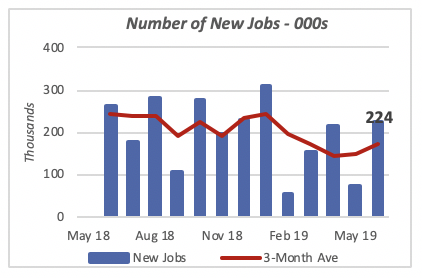
The economy remains strong despite the softer employment growth compared to last year. This is shown by the 3-month average red line in the chart above, which clearly follows a lower path for the last five months, compared to the preceding eight months in the chart. Nonetheless, employers are set to add another 2 million jobs in 2019.
The biggest contributors to job growth this month were Health Care (+35,000), Government(+33,000), and Transportation & Warehouses(+24,000 ). Constructioncontributed with 21,000 new jobs.
Note that the bulk of government work is local. Nine of 10 jobs created by government entities operate at the local level.
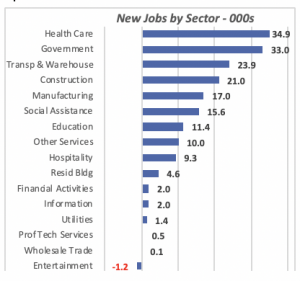
Manufacturing added 17,000 jobs in June, but year-to-date, the net total for the category is just 45,000 jobs. This is less than one-third the number of jobs created in the same period last year.
While the unemployment rate moved slightly to 3.7%, up from the 3.6% previous month, it is still 0.3% lower than what it was a year ago. Hourly wages are still growing at an annual rate of 3.4%, much stronger than a year ago.
Further, the labor participation rate — the percentage of the labor force that is either employed or actively seeking employment — improved minimally to 62.9% last month, but it is exactly the same rate it was a year ago.
Remodeling Market Stumbles
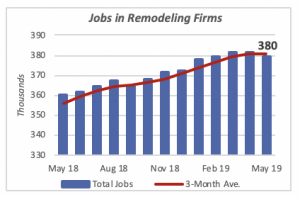
Both the number of workers in remodeling firms and homeowners’ spending on home- remodeling projects dipped slightly in May, the latest month for which data is available.
Hiring workers in remodeling firms fell by 2,200 workers in May but, as the chart below shows, employers have increased their rolls by nearly 20,000 workers over the last 12 months. Remodeling businesses have increased their employment by 47% over the last decade; since the end of the recession in mid-2009, employers in remodeling firms have created 132,000 jobs.
Homeowners’ remodeling expenditures fell in May to an annual rate of $166 billion, just 1% below the preceding month. However, in contrast to the growth in the employment at remodeling firms, spending by homeowners is off by 20% from a year ago. Homeowners were spending at an annual rate of $212 billion in May 2018, or 28% more.
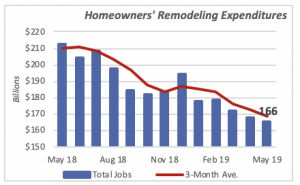
A possible explanation for the apparent contradiction of these two sets of remodeling data is that remodeling spending reflects activities by homeowners only, while employment figures capture hiring by firms that engage in remodeling on all types of buildings, not limited to residential.
Little Change in Mortgage Rates
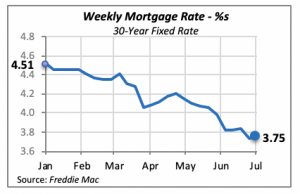
The 30-year fixed mortgage rate moved up modestly to 3.75% last week, up by 0.02%. Given the lack of an active monetary policy pushing interest rates either up or down, we should not expect any pressure on mortgage rates originating from policies emanating from the Federal Reserve Bank in the near future.
Manuel Gutierrez, Consulting Economist to NKBA
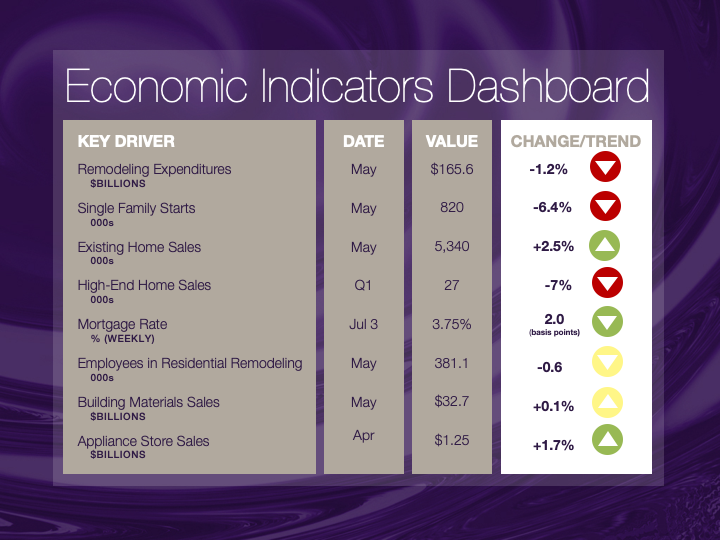
Explanation of NKBA’s Economic Indicators Dashboard
The dashboard displays the latest value of each economic indicator with a colored triangle that highlights visually the recent trend for each of the drivers. “Green” is a positive signal, indicating that the latest value is improving; “Yellow,” as it’s commonly understood, denotes caution because the variable may be changing direction; “Red” indicates that the variable in question is declining, both in its current value and in relation to the recent past.
Note that all the data, except for “mortgage rate” and “appliance-store sales” are seasonally adjusted and are represented at annual rates.
Remodeling Expenditures. This is the amount of money spent on home improvement projects during the month in question. It covers all work done for privately owned homes (excludes rentals, etc.). The data are in billions of dollars and are issued monthly by the U.S. Department of Commerce.
Single-Family Starts. This is the number of single-family houses for which construction was started in the given month. The data are in thousands of houses and are issued monthly by the U.S. Department of Commerce.
Existing-Home Sales. These data are issued monthly by the National Association of Realtors and capture the number of existing homes that were sold in the previous month.
High-End Home Sales. This series are sales of new homes priced at $500,000 and higher. The data are released quarterly by the U.S. Department of Commerce and are not seasonally adjusted. Thus, a valid comparison is made to the same quarter of prior year.
Mortgage Rate. We have chosen the rate on 30-year conventional loans that is issued by the Federal Home Loan Mortgage Corporation (known popularly as Freddie Mac.) Although there are a large number of mortgage instruments available to consumers, this one is still the most commonly used.
Employees in Residential Remodeling. This indicator denotes the number of individuals employed in construction firms that do mostly residential remodeling work.
Building-Materials Sales. These data, released monthly by the Department of Commerce, capture total sales of building materials, regardless of whether consumers or contractors purchased them. However, we should caution that the data also includes sales to projects other than residential houses.
Appliance-Store Sales.This driver captures the monthly sales of stores that sell mostly household appliances; the data are stated at an annual rate. We should not confuse this driver with total appliance sales, since they are sold by other types of stores such as home centers.
We hope you find this dashboard useful as a general guide to the state of our industry. Please contact us at Feedback@nkba.orgif you would like to see further detail.


