

Open Jobs Still Outpace Available Workers
While most financial data continues to bring bad news, employment data paints a different picture. The latest data on job openings confirms that there are currently more jobs available than the number of workers seeking employment. It was over a year ago, in March 2018, when the number of openings exceeded the unemployed for the first time since the Bureau of Labor Statistics began gathering data on open jobs in 2001.
That month, there were 400,000 more jobs than the number of workers seeking employment. The number of job openings was 6.89 million while the number of unemployed workers fell to 6.49 million.
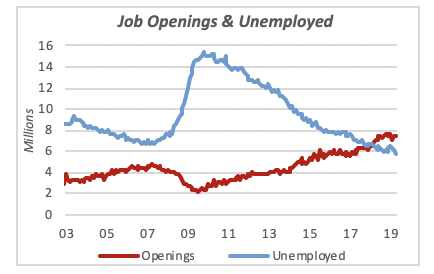
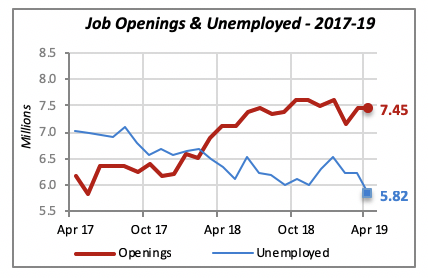
And the gap between job openings and the number of unemployed has continued to widen, as the number of openings reached 7.45 million in April, while at the same time there were 5.82 million persons looking actively for a job. This brings the gap to 1.63 million more jobs available than there are workers seeking employment.
The data may obscure the fact, however, that there could be a mismatch between job requirements and the skills of people looking for employment. It doesn’t help a business that is looking for, say, engineers, while the people seeking a job do not have that training. Moreover, the location of the job might not necessarily be where those unemployed people currently reside.
Manufacturing Shipments and Orders Slide
Other statistics that suggest the U.S. economic slowdown comes from the manufacturing sector. The latest data from manufacturers reveals that both new orders and shipments fell in April, by 0.8% and 0.5% each, respectively. Shipments have fallen in four of the last six months, and orders have fallen in three of the last six months.
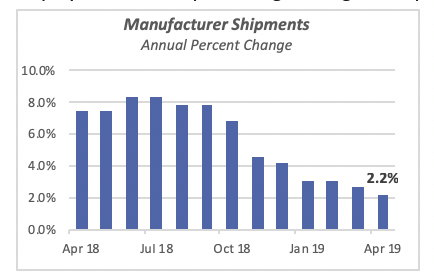
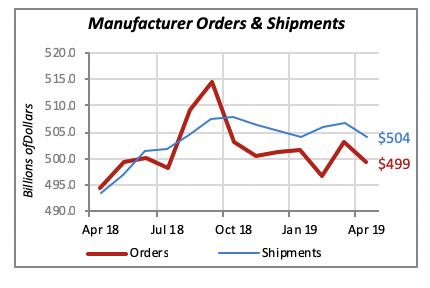
Further, orders and shipments are barely higher than their corresponding levels of a year ago. Shipments fell in April to $504 billion, but are 2.2% higher than they were in April 2018. They had reached a peak of $508 billion in October of last year and have declined since then.
Orders in April were a shade under half a trillion dollars, when they fell to $499.3 billion. New orders from manufacturers peaked in July 2018 at $509 billion.
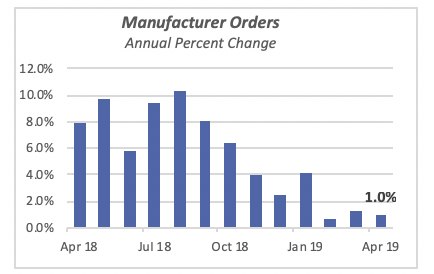
April growth compares unfavorably to the gains seen throughout most of last year, particularly during the summer months, when shipments and orders were over 8% higher than in the same period of 2017.
The declining growth trend in shipments can be easily appreciated in the chart below, which displays the annual percentage change in shipments for the last 13 months.
The more important new orders data follows a similar pattern of continuous decline for nearly a year. Declining new orders naturally will result in declining shipments over the next few months, depending on whether manufacturers have a backlog of orders.
The chart below shows that orders have lagged shipments over the last eight months. New orders are not being generated to the level needed to maintain the higher shipment levels.
Shipments of most product categories declined in April. The month brought gains in only a few product lines, including Beverages & Tobacco (up 4.1%), Petroleum Products (up 2%), Food Products (up 0.8%) and Computers and Electronic Products (up 1%).
The biggest losses were the all-important Transportation Equipment, which includes autos, light trucks and aircraft, among others, and accounts for 17% of the value of shipments; it declined by 4.1% in April. Most of the other categories declined by less than 1% for the month.
Tariffs Might Be Spooking Consumers
The latest report on consumers’ sentiment from the University of Michigan shows a 2.1% decline for June in the index. While the index had risen in May to 100.0, it dropped to 97.9 early this month.
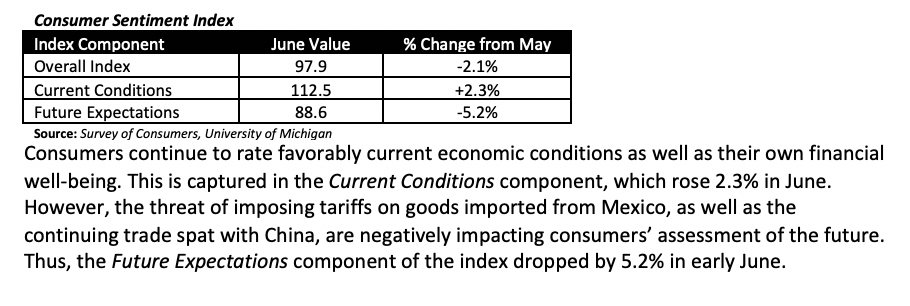
Consumers continue to rate favorably current economic conditions as well as their own financial well-being. This is captured in the Current Conditionscomponent, which rose 2.3% in June. However, the threat of imposing tariffs on goods imported from Mexico, as well as the continuing trade spat with China, are negatively impacting consumers’ assessment of the future. Thus, the Future Expectationscomponent of the index dropped by 5.2% in early June.
Mortgage Rates Remain Unchanged
Even though lower mortgage rates have not yet fully revived the housing market, many homeowners are taking advantage of them to refinance their current loans. Research from the Mortgage Bankers Association reveals that the association’s Refinance Index jumped 47% last week, to the highest level since 2016. Additionally, loan activity for home purchasing is more than 10% above what it was a year ago.
However, as has been reported previously, housing supply is tight and this is preventing many potential homeowners from finding a home to buy.
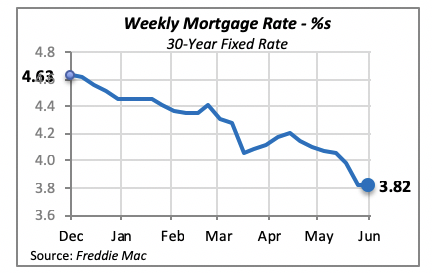
The 30-year fixed mortgage rate remained unchanged last week at 3.82%. The Federal Reserve Board meeting takes place Tuesday and Wednesday, and their decision will determine the direction of interest rates in the near future. There is a lot of pressure on the Fed to move to lower interest rates in order to revive the economy, which according to some measures, appears to be weakening. Many economists expect this will be the direction the board takes.
Manuel Gutierrez, Consulting Economist to NKBA
Explanation of NKBA’s Economic Indicators Dashboard
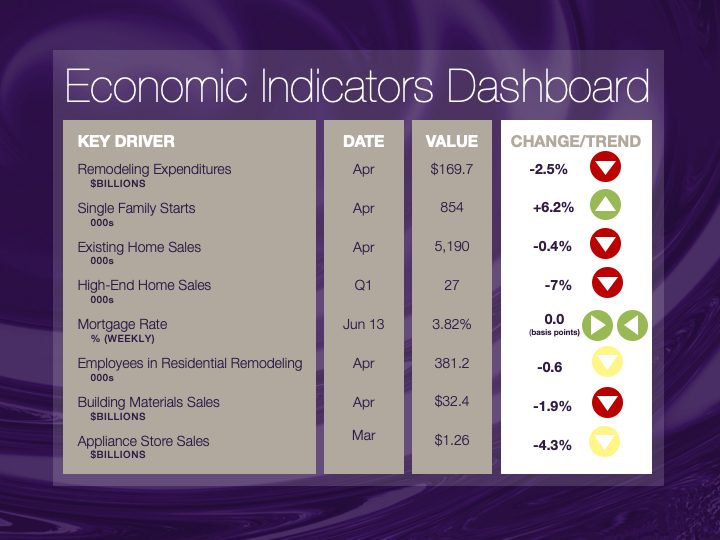
The dashboard displays the latest value of each economic indicator with a colored triangle that highlights visually the recent trend for each of the drivers. “Green” is a positive signal, indicating that the latest value is improving; “Yellow,” as it’s commonly understood, denotes caution because the variable may be changing direction; “Red” indicates that the variable in question is declining, both in its current value and in relation to the recent past.
Note that all the data, except for “mortgage rate” and “appliance-store sales” are seasonally adjusted and are represented at annual rates.
Remodeling Expenditures. This is the amount of money spent on home improvement projects during the month in question. It covers all work done for privately owned homes (excludes rentals, etc.). The data are in billions of dollars and are issued monthly by the U.S. Department of Commerce.
Single-Family Starts. This is the number of single-family houses for which construction was started in the given month. The data are in thousands of houses and are issued monthly by the U.S. Department of Commerce.
Existing-Home Sales. These data are issued monthly by the National Association of Realtors and capture the number of existing homes that were sold in the previous month.
High-End Home Sales. This series are sales of new homes priced at $500,000 and higher. The data are released quarterly by the U.S. Department of Commerce and are not seasonally adjusted. Thus, a valid comparison is made to the same quarter of prior year.
Mortgage Rate. We have chosen the rate on 30-year conventional loans that is issued by the Federal Home Loan Mortgage Corporation (known popularly as Freddie Mac.) Although there are a large number of mortgage instruments available to consumers, this one is still the most commonly used.
Employees in Residential Remodeling. This indicator denotes the number of individuals employed in construction firms that do mostly residential remodeling work.
Building-Materials Sales. These data, released monthly by the Department of Commerce, capture total sales of building materials, regardless of whether consumers or contractors purchased them. However, we should caution that the data also includes sales to projects other than residential houses.
Appliance-Store Sales.This driver captures the monthly sales of stores that sell mostly household appliances; the data are stated at an annual rate. We should not confuse this driver with total appliance sales, since they are sold by other types of stores such as home centers.
We hope you find this dashboard useful as a general guide to the state of our industry. Please contact us at Feedback@nkba.orgif you would like to see further detail.


