

Home Sales Slip
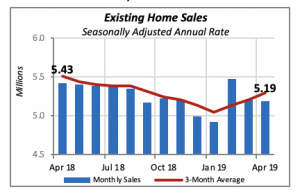
Sales of single-family homes unexpectedly declined in April for both new and existing homes. New single-family home sales fell by nearly 7% to an annualized rate of 673,000 homes, while the drop in sales of existing homes was a nearly negligible 0.4% to a rate of 5.19 million homes sold.
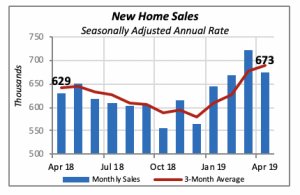
For new homes, the April drop was a surprise, given the gains in sales in the previous three months. However, even after the decline, sales in April are still running 7% above the same month last year.
The median price of a new home sold rose by a robust 8.8% in April to an average of $342,000; this increase negates a similar decline of 8.8% in March. In fact, April prices are the highest since December 2017, more than a year ago.
In the case of existing homes, the sales story is a little different. Despite the impression given by the 3-month average shown by the red line in the chart below, sales of existing homes remain weak and falling. Even though April’s drop was modest, sales are running 4.4% below their pace last year. Were it not for the sharp jump in February, the sales pattern would be a steady decline without any breaks.
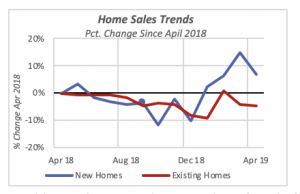
The chart below provides another view of the trends in homes sales for the last year. Each point on the charts reflects sales for a month as a percentage of sales in April 2018. It clearly shows that existing home sales, represented by the red line, have lagged the pace of April 2018 sales every month over the last 12 months. At the same time, new home sales each month this year have exceeded their level of April 2018.
In addition, there are a large number of single-family homes that are built and completed each year, but do not show in the sales records. Those are the homes whereby prospective homeowners hire a contractor directly to manage the building of the house. These houses, normally referred as “contractor-built,” do not show as home sales since no sale transaction is affected.
Currently, about 20% of new homes completed fall in this category. They accounted for 30% to 40% of the total back in the 1970s and 1980s, only to decline steadily through the end of the century. Contractor-built homes gained popularity in the first few years of this century but have resumed their decline since the 2007-09 recession.
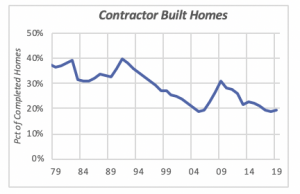
The significance of these homes, although still a substantial number, is that they are homes where the homeowner has a great say in the types and brands of products used in building the home.
Manufacturing Shipments Soften
Besides a weak housing market, the U.S. economy appears to be softening in general. For instance, shipments and new orders for manufactured goods have been falling the last few months. Manufacturing shipments in April were 1.6% lower than the prior month, while new order fell by a sharper 2.1%. They are both lower than their level at the end of last year.

However, compared to April 2018, shipments are still 2.3% higher and orders are running at the same level.
Virtually all types of manufactured goods orders and shipments follow the same general pattern. Most pronounced are the declines in transportation goods, such as autos, trucks and airplanes. Shipments for this group fell 4.1% in April, but orders, which point toward future shipments, are down a more sizable 5.9%.
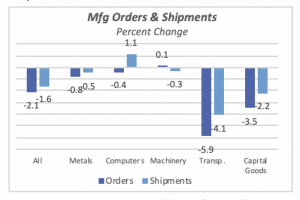
Computer equipment is the only product category still showing some life. Shipments in April were 1.1% higher than in March, although orders also were down by 0.4%.
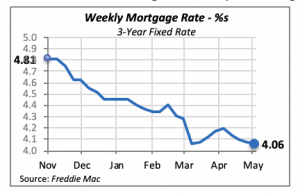
Mortgage Rates Continue to Slide
Mortgage rates edged further down last week, although by only a minimal one basis point to 4.06%. The low and declining mortgage rates do not appear to be sufficient to revive the housing markets, however. As reported previously, there are factors that are impeding greater home sales and housing starts, despite the high employment levels.
Financially, one of the factors hindering greater housing activity might be the high levels of student debt carried by prospective homeowners. This naturally prevents many of them from qualifying for a loan, particularly at affordable rates.
Another factor may be the younger generation’s desire to postpone marriage. Marriages at later ages imply that those consumers are more likely to stay in rental housing rather than purchasing their own home. Home purchases are more likely when people establish households and families, traditionally via marriage. Unless these trends change dramatically, significant gains in homeownership will not occur.
Manuel Gutierrez, Consulting Economist to NKBA
Explanation of NKBA’s Economic Indicators Dashboard
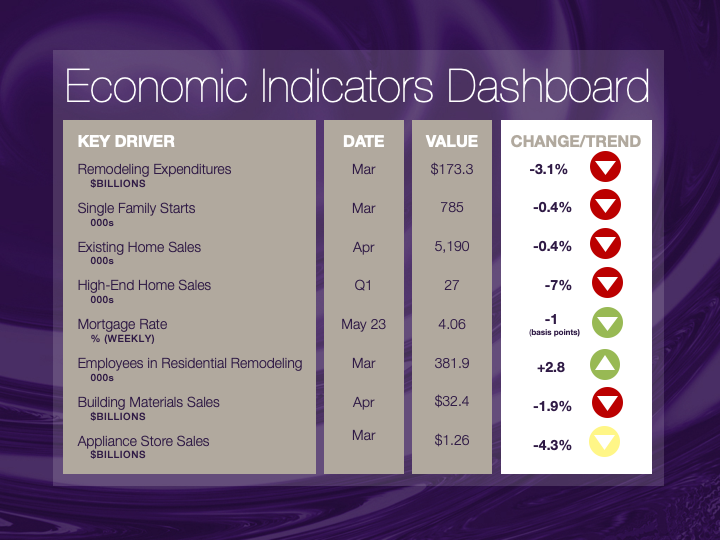
The dashboard displays the latest value of each economic indicator with a colored triangle that highlights visually the recent trend for each of the drivers. “Green” is a positive signal, indicating that the latest value is improving; “Yellow,” as it’s commonly understood, denotes caution because the variable may be changing direction; “Red” indicates that the variable in question is declining, both in its current value and in relation to the recent past.
Note that all the data, except for “mortgage rate” and “appliance-store sales” are seasonally adjusted and are represented at annual rates.
Remodeling Expenditures. This is the amount of money spent on home improvement projects during the month in question. It covers all work done for privately owned homes (excludes rentals, etc.). The data are in billions of dollars and are issued monthly by the U.S. Department of Commerce.
Single-Family Starts. This is the number of single-family houses for which construction was started in the given month. The data are in thousands of houses and are issued monthly by the U.S. Department of Commerce.
Existing-Home Sales. These data are issued monthly by the National Association of Realtors and capture the number of existing homes that were sold in the previous month.
High-End Home Sales. This series are sales of new homes priced at $500,000 and higher. The data are released quarterly by the U.S. Department of Commerce and are not seasonally adjusted. Thus, a valid comparison is made to the same quarter of prior year.
Mortgage Rate. We have chosen the rate on 30-year conventional loans that is issued by the Federal Home Loan Mortgage Corporation (known popularly as Freddie Mac.) Although there are a large number of mortgage instruments available to consumers, this one is still the most commonly used.
Employees in Residential Remodeling. This indicator denotes the number of individuals employed in construction firms that do mostly residential remodeling work.
Building-Materials Sales. These data, released monthly by the Department of Commerce, capture total sales of building materials, regardless of whether consumers or contractors purchased them. However, we should caution that the data also includes sales to projects other than residential houses.
Appliance-Store Sales.This driver captures the monthly sales of stores that sell mostly household appliances; the data are stated at an annual rate. We should not confuse this driver with total appliance sales, since they are sold by other types of stores such as home centers.
We hope you find this dashboard useful as a general guide to the state of our industry. Please contact us at Feedback@nkba.orgif you would like to see further detail.


