

Sales of New Homes Slide
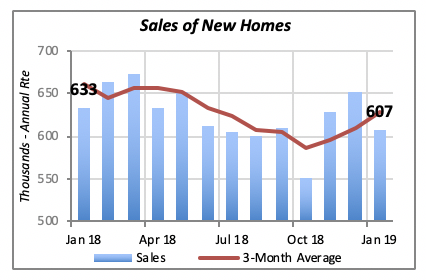
The Federal government is slowly catching up on its release of economic data. While two weeks ago, the data revealed that sales of new homes for the month of December increased by 3.8% on the month to reach an annualized rate of 652,000 units, just last week stats showed that sales slid in January by 6.9% to a rate of 607,000 homes.
January’s new-home sales level was 4% below the same month a year ago, when the rate was 633,000 units.
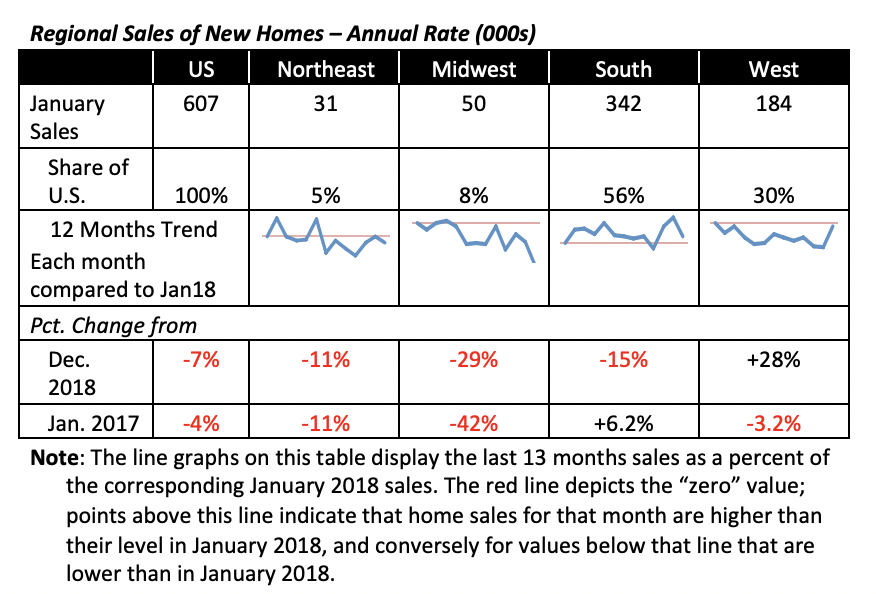
Regionally, sales in three of the four regions fell in January; the exception was the West, where sales actually rose by 28% for the month to a rate of 184,000 units. Sales in the South, which accounts for over half of new-home sales in the nation, fell by 15% for the month. But despite this decline, sales in this region are still 6.2% above their January 2018 level.
In fact, as can be seen in the line graphs in the table below, sales of new homes in the South were consistently higher than what they were in January 2018 throughout virtually all of last year. In contrast, sales in the other regions have been below their corresponding levels in January 2018.
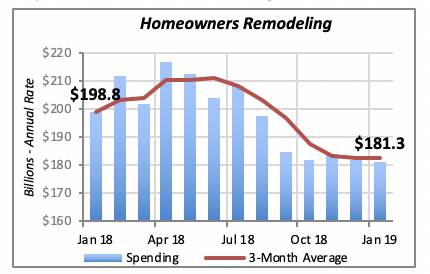
Remodeling Remains Flat in the Short Term
Homeowners’ expenditures for remodeling fell by a modest 0.3% in January, to an annual spending rate $181.3 billion. Remodeling spending has remained relatively stable over the last five months, within a narrow range of around annual spending of $182 billion.
Despite the stable performance hovering around $182 billion since last October, remodeling spending has taken a hit since the first eight months of 2018. Remodeling expenditures were running above $200 billion from January through August last year.
More importantly, remodeling spending is not expected to increase significantly over the next few months because sales of existing homes, a strong driver of remodeling activity, fell 3% last year. That is, the market for potential remodeling jobs originating from home sales was marginally smaller last year.
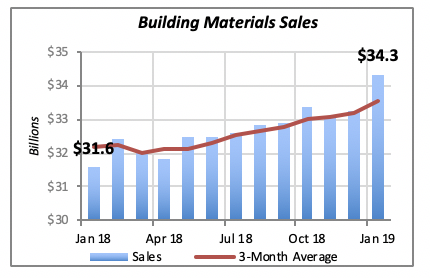
Retail Sales Jump
At the same time, however, sales at building-materials retailers rose by a sharp 3.3% in January. This is the largest monthly increase since September 2017, when they rose by 3.9% for the month. Sales in that month reached $32.6 billion, and even though sales fell slightly in the following five or six months, they rebounded and exceeded that level by the middle of last year.
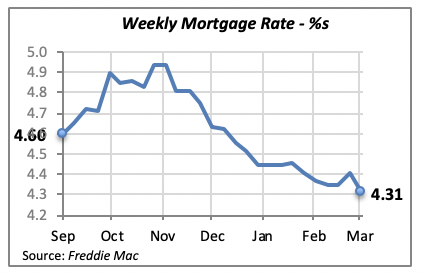
Modest Change on Mortgage Rates
In an interesting but not surprising development, the 30-year fixed mortgage rate fell by 10 basis points to 4.31% last week. The decline is a continuation of the falling trend in interest rates since last November, when they had peaked at 4.94%. This reflects weak demand from slow home construction and declining home sales.
Naturally, such low rates should encourage both home sales as well as refinancing of existing mortgages.
The Federal Reserve Bank has taken a posture of “wait and see” before making any decisions on raising interest rates further. The Fed increased interest rates four times last year, raising the Federal Funds Rate from a near-zero range to its current range of 2.25% to 2.5%. This means that monetary policy is not expected to be a factor influencing mortgage rates in the near term.
Manuel Gutierrez, Consulting Economist to NKBA
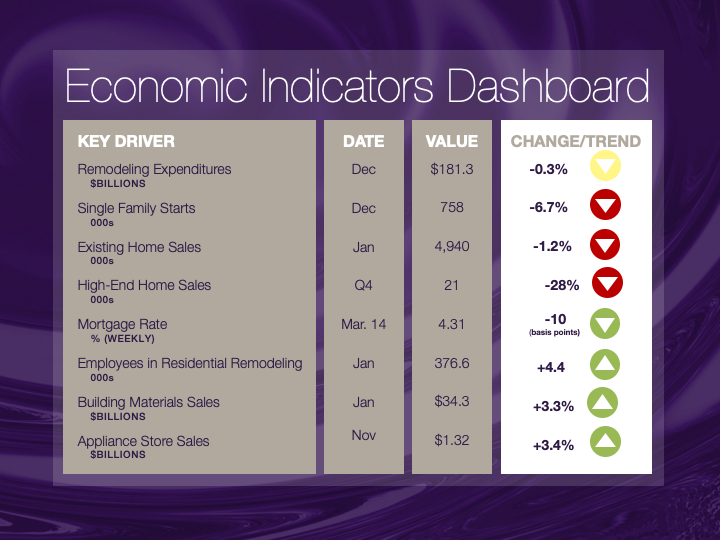
Explanation of NKBA’s Economic Indicators Dashboard
The dashboard displays the latest value of each economic indicator with a colored triangle that highlights visually the recent trend for each of the drivers. “Green” is a positive signal, indicating that the latest value is improving; “Yellow,” as it’s commonly understood, denotes caution because the variable may be changing direction; “Red” indicates that the variable in question is declining, both in its current value and in relation to the recent past.
Note that all the data, except for “mortgage rate” and “appliance-store sales” are seasonally adjusted and are represented at annual rates.
Remodeling Expenditures. This is the amount of money spent on home improvement projects during the month in question. It covers all work done for privately owned homes (excludes rentals, etc.). The data are in billions of dollars and are issued monthly by the U.S. Department of Commerce.
Single-Family Starts. This is the number of single-family houses for which construction was started in the given month. The data are in thousands of houses and are issued monthly by the U.S. Department of Commerce.
Existing-Home Sales. These data are issued monthly by the National Association of Realtors and capture the number of existing homes that were sold in the previous month.
High-End Home Sales. This series are sales of new homes priced at $500,000 and higher. The data are released quarterly by the U.S. Department of Commerce and are not seasonally adjusted. Thus, a valid comparison is made to the same quarter of prior year.
Mortgage Rate. We have chosen the rate on 30-year conventional loans that is issued by the Federal Home Loan Mortgage Corporation (known popularly as Freddie Mac.) Although there are a large number of mortgage instruments available to consumers, this one is still the most commonly used.
Employees in Residential Remodeling. This indicator denotes the number of individuals employed in construction firms that do mostly residential remodeling work.
Building-Materials Sales. These data, released monthly by the Department of Commerce, capture total sales of building materials, regardless of whether consumers or contractors purchased them. However, we should caution that the data also includes sales to projects other than residential houses.
Appliance-Store Sales.This driver captures the monthly sales of stores that sell mostly household appliances; the data are stated at an annual rate. We should not confuse this driver with total appliance sales, since they are sold by other types of stores such as home centers.
We hope you find this dashboard useful as a general guide to the state of our industry. Please contact us if you would like to see further detail.


