

November New Home Sales Surge
The first economic data series released by the Census Bureau since the government resumed operations after the shutdown reported on sales of new homes in November — and they were surprisingly strong. According to the estimates, new home sales jumped 17% in the month to reach an annualized rate of 657,000 units. But compared to the same month for the prior year, November’s home sales are 8% lower.
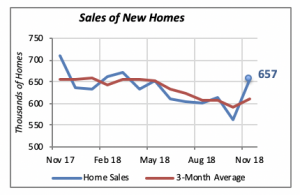
This is the highest level of sales activity since April 2018, but it should be noted that initial estimates on sales of new homes are very uncertain and are typically revised in the following two or three months — sometimes by 10% or more.
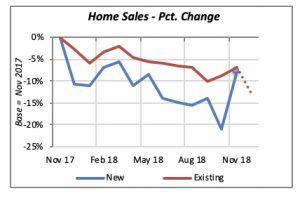
Furthermore, November’s increase in new-home sales mimics that of existing-home sales. The chart below displays the percent change in both new and existing home sales since November 2017. For instance, the lowest point in the new homes (the blue line) is in October 2018, when sales of new homes were more than 20% below the November 2017 volume.
The chart illustrates that both new and existing home sales have been declining, except for some upticks, from November 2017 through November 2018. Additionally, both new and existing home sales improved relatively in November. The dotted line shows that last December’s sales of existing homes more than reversed the gain of the prior month. Observers anticipate that, once December data for new homes is released, it will also show a decline.
Employment Numbers Remain Strong
The 304,000 jobs created in January is a remarkable in two ways. First, it is the 99thconsecutive month when the number of jobs increased. The last time a decline in the number of employed workers was reported was in October 2010, when the nation’s employment was 130.7 million and the number of jobs fell by 136,000.
The magnitude of January’s number is also unusual. Although there have been figures higher than 300,000 new jobs in the past, that threshold is only exceeded 15% of the time.
More significant is the fact that the vast majority of jobs created in January, as well as over the last year, originated in the private sector. While the private sector represents 85% of all jobs — 128 million out of 151 million total American workers — 97% of the jobs created in January were private-sector jobs. Furthermore, 95% of the 2.8 million jobs created over the 12 months ending in January were private-sector jobs.
Construction was the largest contributor to January’s job growth, adding 52,000 jobs or 17% of the total. Other important contributions came in health care (42,000 jobs or 14%), entertainment (31,800 jobs, or 10%), and professional & business services (adding 30,000, or 10%).
Remodeling Employment Rises as Projects Stay Stable
While the number of employees in remodeling firms has been increasing for the last year, expenditures by homeowners on remodeling their homes have remained stagnant.
Employment by remodeling firms reached 373,000 people in December 2018, up a robust 9.8% from its level a year before. That is, remodeling firms have added more than 33,000 workers over the last 12 months.
However, spending by homeowners on remodeling and upkeep of their homes has risen only 1 percent over the last year. Total spending was running at a rate of $200.3 billion in November 2018, only slightly higher than the $198 billion spending rate maintained in November 2017.
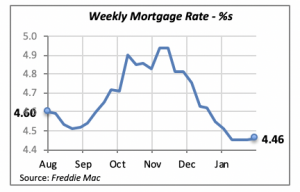
Mortgage Rates Edge Higher
Mortgage rates were virtually flat for most of January. By the end of the month, they had increased by a marginal one basis point to 4.46%. This might help revive the housing markets somewhat, since both sales and construction were impacted by a rising trend observed between September and December.
Moreover, the Fed’s current wait-and-see posture should act as an additional incentive to the housing markets. Chair Jerome Powell’s apparent decision not to push for interest rate increases in the near future, based on what he thought was a faltering economy, removes any pressure on mortgage rates arising from the Fed’s monetary policy.
Manuel Gutierrez, Consulting Economist to NKBA
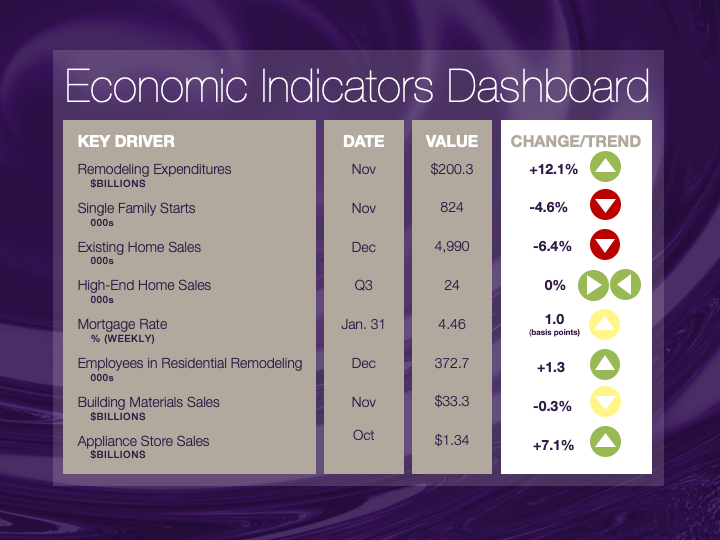
Explanation of NKBA’s Economic Indicators Dashboard
The dashboard displays the latest value of each economic indicator with a colored triangle that highlights visually the recent trend for each of the drivers. “Green” is a positive signal, indicating that the latest value is improving; “Yellow,” as it’s commonly understood, denotes caution because the variable may be changing direction; “Red” indicates that the variable in question is declining, both in its current value and in relation to the recent past.
Note that all the data, except for “mortgage rate” and “appliance-store sales” are seasonally adjusted and are represented at annual rates.
Remodeling Expenditures. This is the amount of money spent on home improvement projects during the month in question. It covers all work done for privately owned homes (excludes rentals, etc.). The data are in billions of dollars and are issued monthly by the U.S. Department of Commerce.
Single-Family Starts. This is the number of single-family houses for which construction was started in the given month. The data are in thousands of houses and are issued monthly by the U.S. Department of Commerce.
Existing-Home Sales. These data are issued monthly by the National Association of Realtors and capture the number of existing homes that were sold in the previous month.
High-End Home Sales. This series are sales of new homes priced at $500,000 and higher. The data are released quarterly by the U.S. Department of Commerce and are not seasonally adjusted. Thus, a valid comparison is made to the same quarter of prior year.
Mortgage Rate. We have chosen the rate on 30-year conventional loans that is issued by the Federal Home Loan Mortgage Corporation (known popularly as Freddie Mac.) Although there are a large number of mortgage instruments available to consumers, this one is still the most commonly used.
Employees in Residential Remodeling. This indicator denotes the number of individuals employed in construction firms that do mostly residential remodeling work.
Building-Materials Sales. These data, released monthly by the Department of Commerce, capture total sales of building materials, regardless of whether consumers or contractors purchased them. However, we should caution that the data also includes sales to projects other than residential houses.
Appliance-Store Sales.This driver captures the monthly sales of stores that sell mostly household appliances; the data are stated at an annual rate. We should not confuse this driver with total appliance sales, since they are sold by other types of stores such as home centers.
We hope you find this dashboard useful as a general guide to the state of our industry. Please contact us if you would like to see further detail.


