

Retail Sales Plunge Amid Further Layoffs
More bad news for stores: total sales at retailers plummeted in April for the third consecutive month to $404 billion, a drop of 16.4% for the month. This follows an 8.3% drop in March.
For the first four months of the year, sales reached $1.94 trillion, 4.6% below same period of 2019. Strong sales in January prevented the year-to-date total from being a total disaster.
Given that the majority of consumers have been forced to stay home and have not been able to shop freely in stores, it is not a great revelation to say that sales at all store types fell by double-digits in April.
The only exception was Internet & Mail Order sales, which rose by 8.4% last month. In fact, as the chart below clearly shows, they have increased at a faster rate each successive month this year. Aside from the gain in Internet & Mail Order businesses, sales at Building Materials stores had the smallest decline among all store types. Sales fell by just 3.5% in April, after a much smaller 0.5% drop in March.
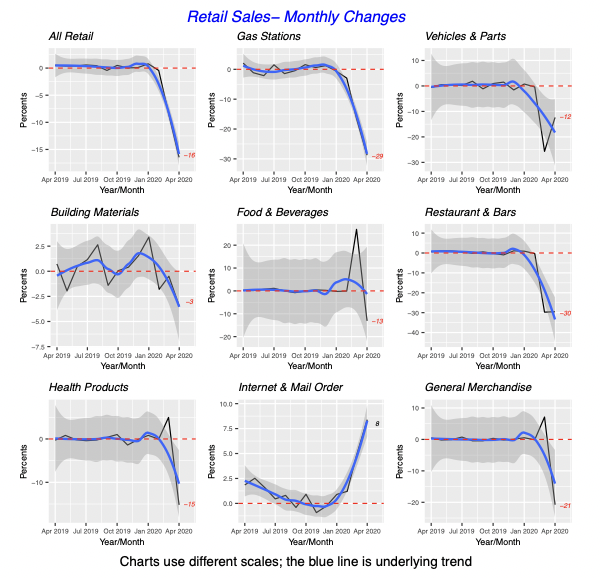
Year-to-date, sales at most store types are running behind the same period last year, although three store categories are ahead of 2019. Internet & Mail Order sales reached $288 billion through April and are 13% ahead of last year. They currently account for 15% of all retail sales dollars. Although Amazon is often used as a gauge of Internet sales, it should be noted that despite its huge presence, between a quarter and a third of its sales originate internationally, and more than 10% of its revenue originates from its cloud services.
A second store type that is also running ahead of last year is sales at Food & Beverage stores, which are up 11.6% over 2019 through April, and account for 14% of total retail sales.
Finally, sales at Building Materials stores are 2.9% above last year and account for 7% of total retail sales.
Although many states are already allowing businesses to reopen, Observers don’t expect a great and immediate improvement in sales activity. Compared to April, sales in May will rise, but will still be below 2019, year-over-year.
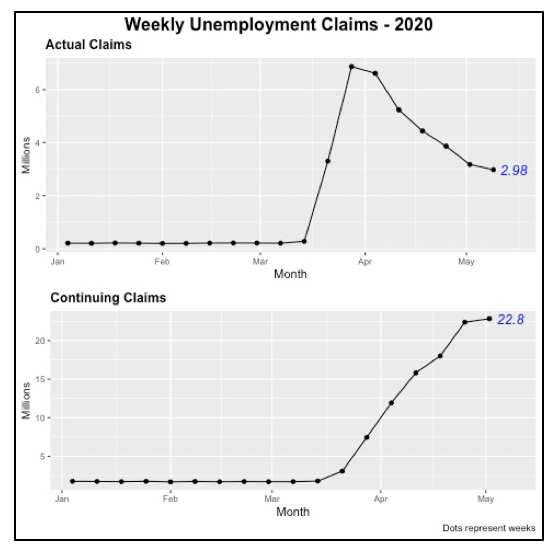
Unemployed Rolls Continue to Rise
Another 3 million people filed for unemployment benefits last week. Even though the number is slightly lower than the previous week, by 195 thousand, the total on record who have lost their job since mid-March has already reached 36.5 million.
At least 3 million people have been added to the unemployment rolls every week for the last two months.
A Glimmer of Hope Among Consumers
The University of Michigan’s Index of Consumer sentiment actually rose in May to 73.7, up from 71.8 in April. The increase came as a surprise, since most forecasts had called for a further decline; for instance, the Dow Jones forecast had predicted the index would drop to 65 points.
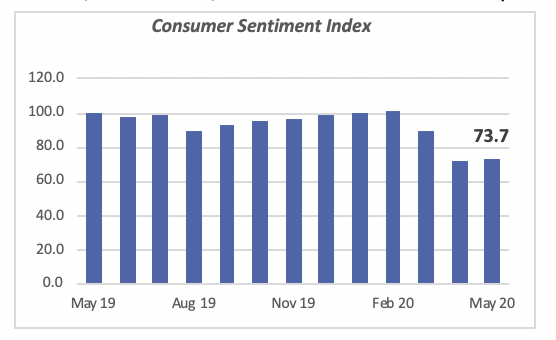
According to Richard Curtin, director of the University’s survey division, the government sending checks to consumers and widespread price discounting helped boost consumers‘ buying attitudes. One of the index components, Current Conditions, actually jumped more dramatically — by 8.7 points — to 83 in May. This was a welcome reversal, since the Current Conditions index had been falling since December, when it was 115.5.
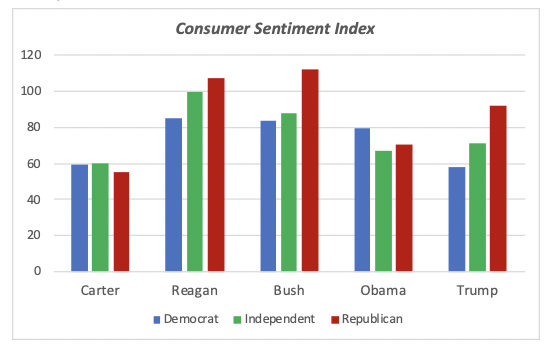
The University of Michigan provides information on how personal attributes of consumers influence their assessments. For instance, it shows attitudes classified by household income, but an interesting barometer of consumer ratings is by political leanings or affiliation.
Apparently, the beauty of the consumer economy is in the eye of the beholder. As seen in the chart below, consumers’ political leanings color their views according to the political party of the current president. The chart below reflects consumers’ current views of the economy, and their views collected during the times of various administrations going back to mid-Seventies and the Carter administration. Note that consumers ratings are higher when their political party is in power. Regardless of the prevailing economic conditions, Democrats’ ratings are higher than those of Republicans under the Carter or Obama presidencies. Conversely, Republicans’ ratings are higher when a Republican is president: Reagan, Bush or Trump.
The ratings among consumers who call themselves Independent fall within those of the other two parties.
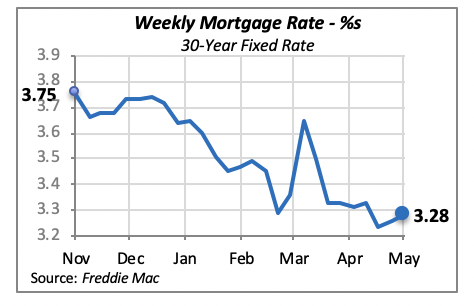
Mortgage Rates Inch Higher
Mortgage rates moved up modestly last week to 3.28%, up just two basis points from the prior week. At the same time, last week the Mortgage Bankers Association found a modest increase in mortgage applications, up by 0.3% from the preceding week.
This was the result of a 3% drop in the refinance segment of the business, somewhat compensated by an 11% gain in home purchases.
Manuel Gutierrez, Consulting Economist to NKBA
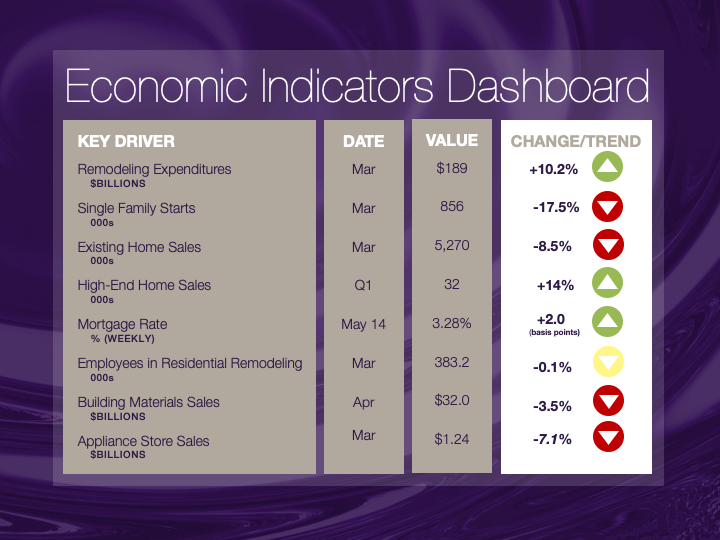
Explanation of NKBA’s Economic Indicators Dashboard
The dashboard displays the latest value of each economic indicator with a colored triangle that highlights visually the recent trend for each of the drivers. “Green” is a positive signal, indicating that the latest value is improving; “Yellow,” as it’s commonly understood, denotes caution because the variable may be changing direction; “Red” indicates that the variable in question is declining, both in its current value and in relation to the recent past.
Note that all the data, except for “mortgage rate” and “appliance-store sales” are seasonally adjusted and are represented at annual rates.
Remodeling Expenditures. This is the amount of money spent on home improvement projects during the month in question. It covers all work done for privately owned homes (excludes rentals, etc.). The data are in billions of dollars and are issued monthly by the U.S. Department of Commerce.
Single-Family Starts. This is the number of single-family houses for which construction was started in the given month. The data are in thousands of houses and are issued monthly by the U.S. Department of Commerce.
Existing-Home Sales. These data are issued monthly by the National Association of Realtors and capture the number of existing homes that were sold in the previous month.
High-End Home Sales. This series are sales of new homes priced at $500,000 and higher. The data are released quarterly by the U.S. Department of Commerce and are not seasonally adjusted. Thus, a valid comparison is made to the same quarter of prior year.
Mortgage Rate. We have chosen the rate on 30-year conventional loans that is issued by the Federal Home Loan Mortgage Corporation (known popularly as Freddie Mac.) Although there are a large number of mortgage instruments available to consumers, this one is still the most commonly used.
Employees in Residential Remodeling. This indicator denotes the number of individuals employed in construction firms that do mostly residential remodeling work.
Building-Materials Sales. These data, released monthly by the Department of Commerce, capture total sales of building materials, regardless of whether consumers or contractors purchased them. However, we should caution that the data also includes sales to projects other than residential houses.
Appliance-Store Sales. This driver captures the monthly sales of stores that sell mostly household appliances; the data are stated at an annual rate. We should not confuse this driver with total appliance sales, since they are sold by other types of stores such as home centers.
We hope you find this dashboard useful as a general guide to the state of our industry. Please contact us at Feedback@nkba.org if you would like to see further detail.


