

New Home Sales Stumble
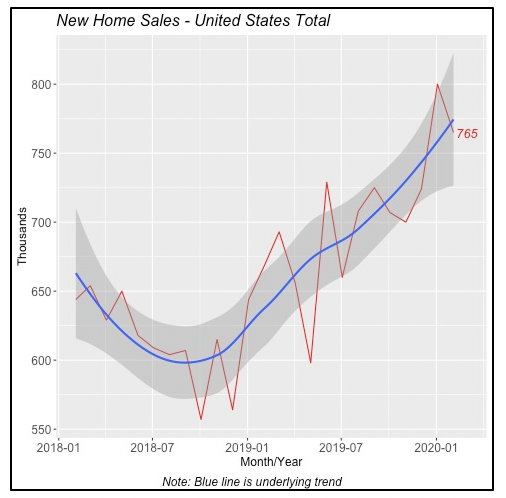
Contrasting the positive increase in sales of existing homes reported last week, sales of new homes actually fell in February to an annualized rate of 765,000 units. This is a 4.4% drop from January sales, which were revised up by 36,000 units to 800,000 (annualized).
Although sales of new homes had been recovering over the last year-and-a-half, the nation now faces the uncertainty of how far sales will fall over the next few months as a consequence of the coronavirus pandemic. Sales in March, for instance, are understandably expected to be minimal, as most of the country virtually shut down for the last two weeks.
Further, COVID-19’s impact on employment on the K&B and construction industries will not be known until the end of this week, when those numbers are released on April 4. Many workers in the kitchen and bath industry rely on direct face-to-face contact for their businesses, which is virtually impossible today.
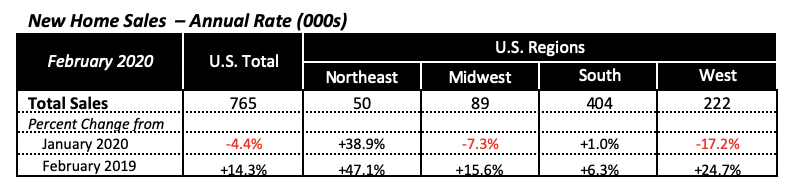
Regionally, sales of new homes moved up in two areas. Sales in the Northeast jumped by 39% in February, but this region has very little housing activity with sales of only 50,000 units (annualized rate), representing less than 10% of national sales.
The other region with increased sales, the South, gained just 1% from the prior month to reach an annual pace of 404,000 units. The South accounts for half of the nation’s housing activity — in new home sales, sales of existing homes as well as housing starts.
The West, which typically contributes between 25% and 30% to the nation’s total, had a substantial 17.2% drop in sales. Despite this decline, sales in the West outpaced February 2019 by nearly 25%. Sales in the Midwest fell by 7.3% in February.
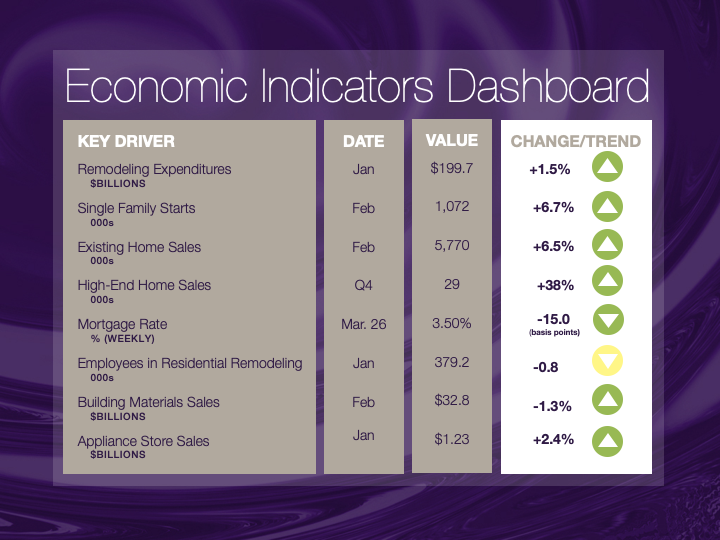
Unfortunately, the pandemic will turn 2020, which was poised to be a banner year, into at best an average year in home sales. But more likely, sales could potentially plummet to recession levels. The robust direction in which the industry was moving in the first two months of the year is illustrated by the “NKBA Economic Indicators Dashboard,” which shows that virtually all the indicators displayed a “green” trend.
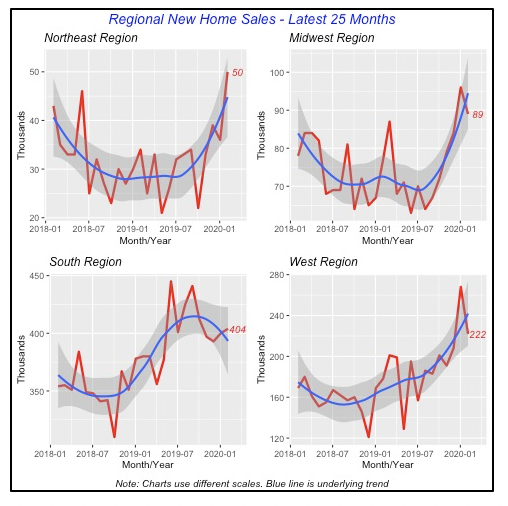
In fact, new home sales in the South had already stalled toward the end of last year, as can be seen in the chart below.
Unemployment Claims Soar
The unemployment claims chart below, similar to what has been splattered all over the press in recent weeks, highlights the severe impact that the pandemic is having on the nation’s employment. For the week ended March 21, total claims for unemployment reached 3.28 million. The two red lines in the chart mark the official beginning and end of the last recession. At its peak in March 2009, claims reached 665,000.
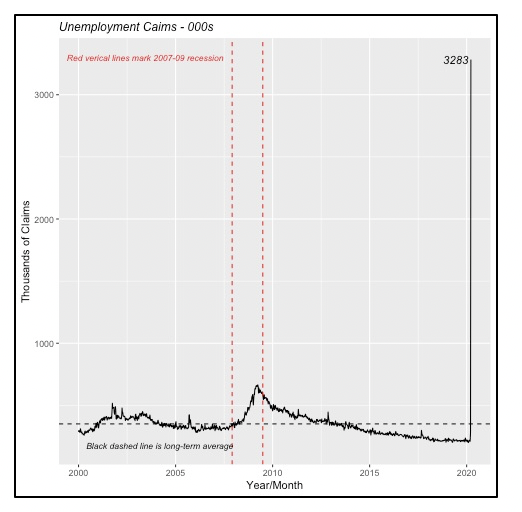
More of the same is expected over the next few weeks, especially since the policy mandating that most people stay home was extended through April 30.
Manufacturer Shipments Rise
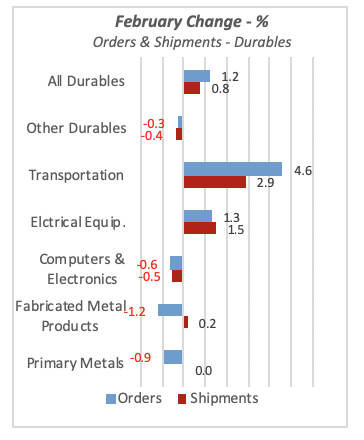
Shipments of manufacturers’ durable goods rose by 0.8% in February, while new orders increased by a faster 1.2% over the preceding month. Durable goods, which are typically defined as products that last three years or more and are purchased infrequently, represent about half of all manufactured goods.
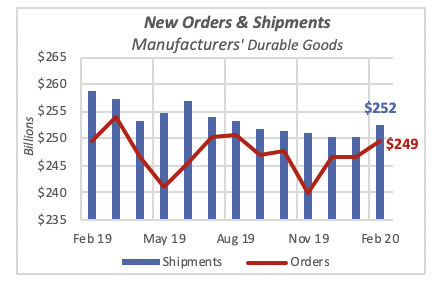
Sadly, prior to the devastation that COVID-19 is causing in the U.S. economy, both orders and shipments were moving in the right direction: up. New orders had increased in each of the previous three months, finally reversing the trend of declining orders seen in the second half of last year.
February’s increase in shipments, albeit a small 0.8%, was the first increase in shipments since June 2019. That is, the gain is a contrast to the monthly declines seen over the last seven months. But February’s increase in both orders and shipments was driven by substantial increases in transportation goods, that jumped 2.9% and 4.6% in the month, respectively. Shipments of transportation goods reached $85 billion in February, which is one-third of the value of all durable goods. Furthermore, within the transportation category Motor Vehicles & Parts are its largest category, accounting for nearly one-quarter of all durable goods shipments or orders.
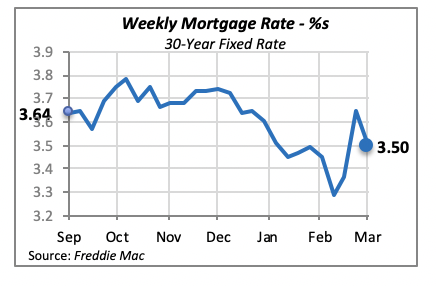
Mortgage Rates Fall as Demand Drops
Likely the result of a drop in demand for mortgage loans, interest rates fell by 15 basis points last week to 3.5%. Lower rates are, of course, more favorable to home building and home purchasing, as well as home remodeling. Given the current state of virtual nationwide lockdown, however, the lower rate is not likely to do much to keep the markets alive.
Manuel Gutierrez, Consulting Economist to NKBA
Explanation of NKBA’s Economic Indicators Dashboard
The dashboard displays the latest value of each economic indicator with a colored triangle that highlights visually the recent trend for each of the drivers. “Green” is a positive signal, indicating that the latest value is improving; “Yellow,” as it’s commonly understood, denotes caution because the variable may be changing direction; “Red” indicates that the variable in question is declining, both in its current value and in relation to the recent past.
Note that all the data, except for “mortgage rate” and “appliance-store sales” are seasonally adjusted and are represented at annual rates.
Remodeling Expenditures. This is the amount of money spent on home improvement projects during the month in question. It covers all work done for privately owned homes (excludes rentals, etc.). The data are in billions of dollars and are issued monthly by the U.S. Department of Commerce.
Single-Family Starts. This is the number of single-family houses for which construction was started in the given month. The data are in thousands of houses and are issued monthly by the U.S. Department of Commerce.
Existing-Home Sales. These data are issued monthly by the National Association of Realtors and capture the number of existing homes that were sold in the previous month.
High-End Home Sales. This series are sales of new homes priced at $500,000 and higher. The data are released quarterly by the U.S. Department of Commerce and are not seasonally adjusted. Thus, a valid comparison is made to the same quarter of prior year.
Mortgage Rate. We have chosen the rate on 30-year conventional loans that is issued by the Federal Home Loan Mortgage Corporation (known popularly as Freddie Mac.) Although there are a large number of mortgage instruments available to consumers, this one is still the most commonly used.
Employees in Residential Remodeling. This indicator denotes the number of individuals employed in construction firms that do mostly residential remodeling work.
Building-Materials Sales. These data, released monthly by the Department of Commerce, capture total sales of building materials, regardless of whether consumers or contractors purchased them. However, we should caution that the data also includes sales to projects other than residential houses.
Appliance-Store Sales. This driver captures the monthly sales of stores that sell mostly household appliances; the data are stated at an annual rate. We should not confuse this driver with total appliance sales, since they are sold by other types of stores such as home centers.
We hope you find this dashboard useful as a general guide to the state of our industry. Please contact us at Feedback@nkba.org if you would like to see further detail.


