

Employment Growth Hits a Wall
This week’s numbers provide the first glimpse of the impact Coronavirus is having on the “real’ economy. Up to now, most of the statistical news has been from Wall Street’s perspective on the U.S. economy, revealing the impact that the pandemic is having on the financial markets.
But data on the Main Street economy is slower in coming, because the processes of gathering the data, and the actual sources of data, are dispersed across various agencies and throughout the land. This week offers the first view with data on the number of people who file for unemployment each week, the Weekly Unemployment Claims. Data was released last Friday but reflects activity on the prior week, that is the week ending on March 14.
In the top graph in the chart below, which plots weekly claims for the last year (53 weeks in fact), clearly shows the jump of claims to 281,000, up from a weekly average of 217,000 claims maintained throughout the previous year.
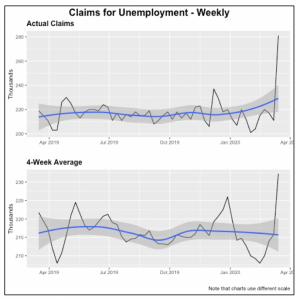
The lower graph, which plots a 4-week moving average and is typically used to smooth out the data, brings the latest data point to 231,000 persons filing claims.
Nonetheless, the number of claims jumped by a third in just one week. And a still more dramatic increase is expected when official data is released for last week, as well as the next few weeks. The data will capture the full impact of the current dire economic situation, in which complete industries are being decimated. For now, the initial impact has been on the hospitality and food industries, as well as transportation (i.e., airlines.) Soon, the impact from the closing of auto industry plants, as well as a large number of retail businesses, will be reflected in the data.
Housing Starts Hold Up Through February
After a robust roll, this month is very likely the last time for a long while that favorable news will emanate from the housing markets. Housing starts in February came in at an annualized rate of 1.60 million units; this is just slightly lower than the average rate of 1.61 million units of the preceding two months. Further, February’s rate was 300,000 units higher than last year’s total of 1.29 million houses started. It has been more than a decade — the end of 2006, in fact — since the monthly rate was higher than that of the last three months.
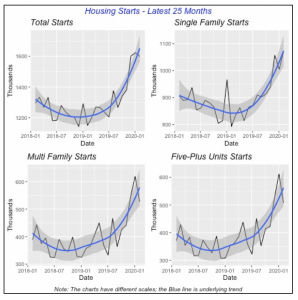
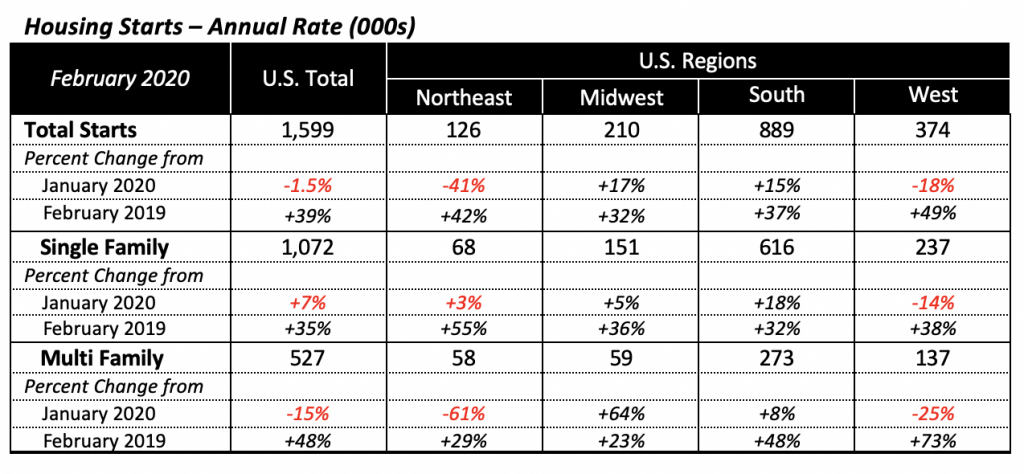
February’s drop in total housing starts rate was driven by a 15% decline in multifamily housing starts, compensated by a 7% gain in construction of single-family units.
Regionally, housing construction fell in two of the regions: the Northeast, down 41% for the month, and the West which fell by 18%. But their declines were compensated by gains in the other two regions, particularly the South region’s 15% jump. The South is the most important of the four regions, accounting for well over half of February’s new houses; in fact, the region accounts for 56% of the nation’s February housing starts.
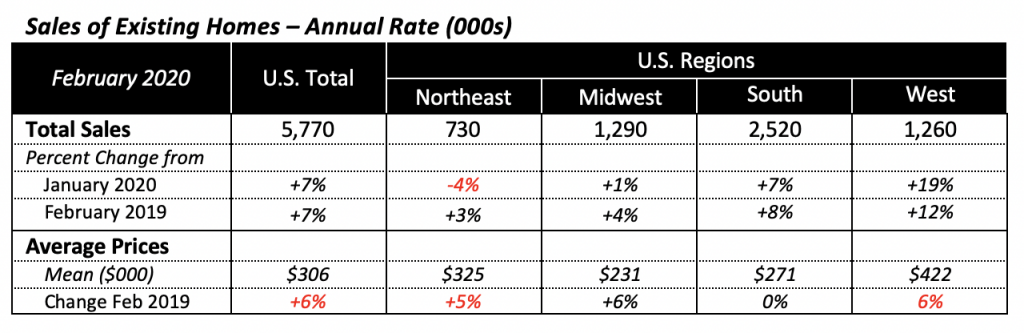
Sales of Existing Homes Sales Strong in February
Similar to new housing construction, data for sales of existing homes in February was strongly positive. Sales reached an annual rate of 5.78 million units, a 6.5% jump over the preceding month, when sales had dropped 2% to a rate of 5.42 million units.
February’s percentage increase was the highest since the 8% gain posted exactly a year before, in February 2019. Moreover, February’s pace was the highest in 12 years and was marking the beginnings of a very strong year for 2020. The totally unforeseen Coronavirus pandemic is putting a stop to all of this, however.
Regionally, sales in the Northeast fell to an annual rate of 700,000 units, a 4% drop, but in the other three regions, sales increased substantially. The largest gain was in the West, where sales jumped by nearly 19% to an annualized 1.26 million units.
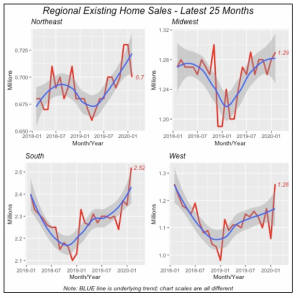
Sales in the South, the region with most housing activity, rose 7% last month to reach 2.52 million (annualized). But in the Midwest, existing home sales were relatively unchanged, increasing less than 1% to a 1.29 million pace.
Average home prices rose 6% compared to 2019, although the median price was up 8%. The inventory of homes for sale remains low, representing only three months of supply at the current sales pace.
Retail Sales Slip
U.S. total retail sales fell 0.5% in February, to $528 billion for the month. Excluding Vehicles & Parts, sales fell by 0.4%. Sales declined for the first time in five months, even though most of February (except for the last week) was not affected by the initial draconian measures aimed at controlling the spread of coronavirus.
Sales in most types of store categories fell last month, with the exception of online and mail-order sales, which rose 0.7% for the month. Largest declines last month were in Gas Stations which fell by 2.8%, and Vehicles & Parts which fell by 0.9%.
Given the virtual shutdown of the U.S. economy, except for a few store types and online sales, most observers anticipate that sales will continue to plummet in the next few months. This is exacerbated perhaps by the downward pressure on oil prices and gasoline prices at the pump, driven by the dispute between Saudi Arabia and Russia, which led the Saudi government to increase oil production, thus driving prices down.
Although falling oil and gasoline prices benefit consumers greatly, they will have a negative impact on U.S. oil production. Many oil wells in the U.S. have been productive because the higher world oil prices enabled those wells, many of them using fracking technology, to pump oil profitably.
Surprisingly, Mortgage Rates Spike
Contrary to expectations, last week’s move by the Federal Reserve Bank to lower interest rates was not immediately successful, since interest rates have increased substantially. The 30-year, fixed mortgage rate, for instance, rose by 29 basis points last week to 3.65%, just a shade below its value six months ago.
The Fed’s intention was to buy government securities, such as Treasury bills, which would increase their price and, mathematically by definition, lower the yield — which would pressure all types of interest rates to fall. But, unforeseen, the world’s appetite turned to cold hard cash, i.e. dollars, which means the supply of securities increases and their price falls, and thus, interest rates rise.
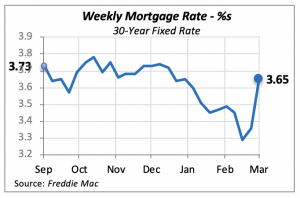
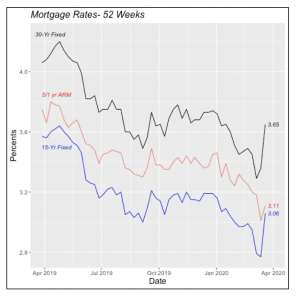
Given the state of the current pandemic, it appears in retrospect that consumers and businesses are showing a preference for cash over securities. The same impact on interest rates can be seen in the chart below, displaying the three most common types of mortgage loans.
Manuel Gutierrez, Consulting Economist to NKBA
Explanation of NKBA’s Economic Indicators Dashboard
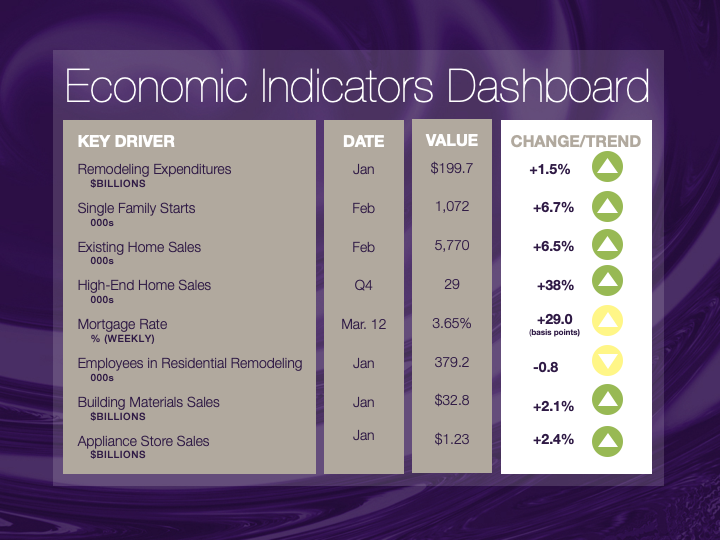
The dashboard displays the latest value of each economic indicator with a colored triangle that highlights visually the recent trend for each of the drivers. “Green” is a positive signal, indicating that the latest value is improving; “Yellow,” as it’s commonly understood, denotes caution because the variable may be changing direction; “Red” indicates that the variable in question is declining, both in its current value and in relation to the recent past.
Note that all the data, except for “mortgage rate” and “appliance-store sales” are seasonally adjusted and are represented at annual rates.
Remodeling Expenditures. This is the amount of money spent on home improvement projects during the month in question. It covers all work done for privately owned homes (excludes rentals, etc.). The data are in billions of dollars and are issued monthly by the U.S. Department of Commerce.
Single-Family Starts. This is the number of single-family houses for which construction was started in the given month. The data are in thousands of houses and are issued monthly by the U.S. Department of Commerce.
Existing-Home Sales. These data are issued monthly by the National Association of Realtors and capture the number of existing homes that were sold in the previous month.
High-End Home Sales. This series are sales of new homes priced at $500,000 and higher. The data are released quarterly by the U.S. Department of Commerce and are not seasonally adjusted. Thus, a valid comparison is made to the same quarter of prior year.
Mortgage Rate. We have chosen the rate on 30-year conventional loans that is issued by the Federal Home Loan Mortgage Corporation (known popularly as Freddie Mac.) Although there are a large number of mortgage instruments available to consumers, this one is still the most commonly used.
Employees in Residential Remodeling. This indicator denotes the number of individuals employed in construction firms that do mostly residential remodeling work.
Building-Materials Sales. These data, released monthly by the Department of Commerce, capture total sales of building materials, regardless of whether consumers or contractors purchased them. However, we should caution that the data also includes sales to projects other than residential houses.
Appliance-Store Sales. This driver captures the monthly sales of stores that sell mostly household appliances; the data are stated at an annual rate. We should not confuse this driver with total appliance sales, since they are sold by other types of stores such as home centers.
We hope you find this dashboard useful as a general guide to the state of our industry. Please contact us at Feedback@nkba.org if you would like to see further detail.


