

Coronavirus Impact Unknown, but U.S. Foreign Trade Position Reflects Improvement
It is important to note that the data reported here is for the month of January, before any disruptions owing to coronavirus began to have an effect.
However, data over the last 18 months shows the U.S. trade position has been improving, since the time that the Trump administration began to dismantle trade agreements and put in place tariffs, or the threat of imposing tariffs, on goods coming from some countries.
As such, the U.S. balance of goods and services trade improved in January to a negative-$45.3 billion; this is $3.3 billion better than December’s balance of $48.6 billion. Although both imports and exports fell in January, the latter’s decline was larger. That is, exports were $907 million lower than the previous month, but imports dropped four times as much, by $4.2 billion.
Over the 12 months ended in January, the U.S. balance of trade is a negative-$608 billion. This means that foreign businesses and countries increased their holdings of U.S. dollars or securities.
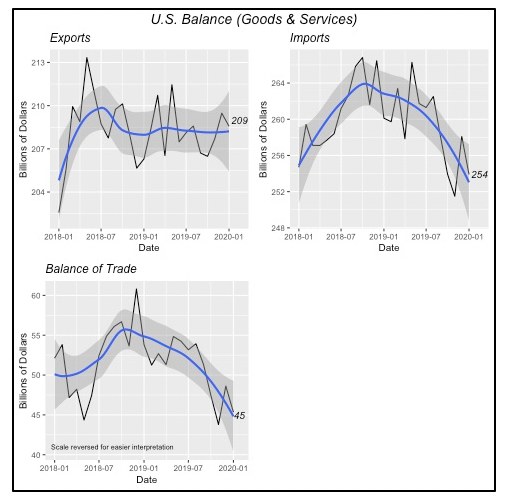
Despite all the trade policy disputes with other countries over the last couple of years, U.S. exports have been stable, as the chart above shows, with a relatively flat trend over the last year-and-a-half, neither increasing nor decreasing noticeably. Exports were $208.6 billion in January, very close to their levels in July 2018, when U.S. exports were $208.7 billion.
At the same time, U.S. imports of goods and services have been declining during this same period, falling to $253.9 billion in January, almost 3% lower than its level in July 2018.
The net result is an improvement in the U.S. balance of trade, both for goods and services, that had jumped as high as $60.8 billion in December 2018, only to fall to January’s $45 billion cited above.
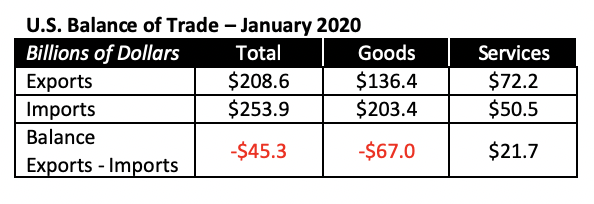
The table below shows that the U.S. keeps a positive balance in services — we export more services to other countries than we import from them — although the total value of services trade (imports plus exports) is only about a third of the total value of the trade of goods. Services include such activities as tourism, financial services, accounting, use of intellectual property, etc.
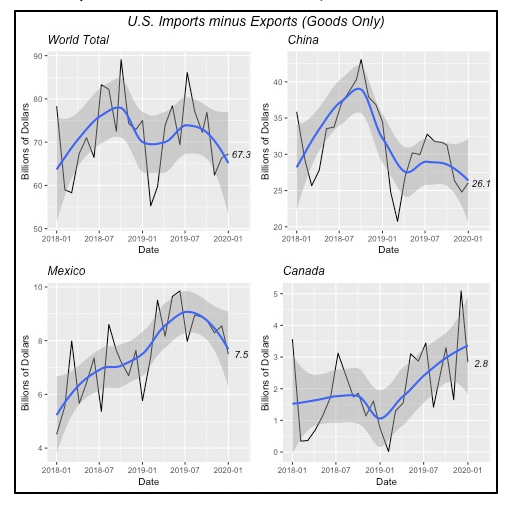
Exports and Imports of Goods – Key Countries
The U.S. improvements in the balance of trade from $60.8 billion to January’s $45.3 billion is the result of improvement across most countries. This is particularly the case of “goods” trade with China, which has dropped by $8.4 billion in January compared to a year ago. For the 12 month period ending in January, the U.S. trade deficit with China is $337 billion; this is nearly $81 billion lower than the preceding twelve month period.
But for Mexico and Canada the situation is reversed, very likely because some of the goods originally imported from China may be now imported from these two countries. For both countries, the gap between U.S. imports and exports has increased. For the last 12 months, the U.S. balance with Mexico has increased by $21.6 billion to $103.5 billion total, while with Canada, the increase is smaller at $12.9 billion.
Consumer Sentiment
Two recently released surveys that measure consumer sentiment give us a glimpse of the current state of consumers’ minds regarding the economy and their personal prospects.
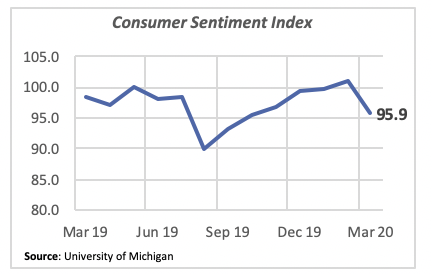
The first one, the University of Michigan’s Consumer Sentiment Index, is the most current since the interviews were conducted in the first two weeks of this month and captures the impact of Coronavirus so far. It is prior to the virtual closing of the nation, however.
As one would expect given the daily barrage of the stock market’s plunge and the increasingly dire news about the pandemic, the overall index fell to 95.9 in early March, down from 101.0 last month. Naturally, this number is expected to drop further once the full set of interviews are completed and the final figure is released at the end of the month.
Consumers expect the greatest impact to come in the near future, with prospects for little growth in the economy. Even if the pandemic is of short duration, the impact on the economy will be longer. That’s the reason that the Administration and Congress are looking for ways to sustain the economy via greater spending and/or tax relief.
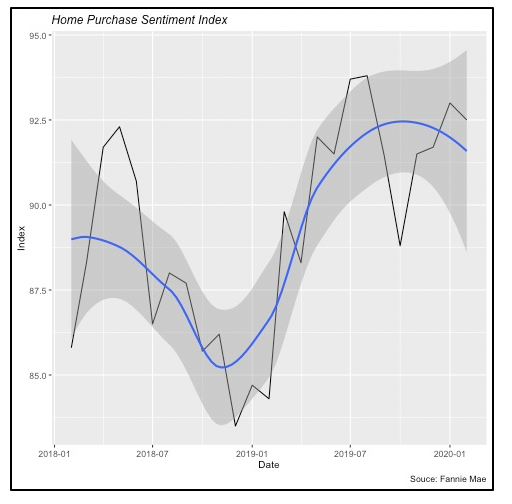
The second sentiment index is Fannie Mae’s Home Purchase Sentiment Index, which measures, as the name clearly implies, consumers’ views on home purchases.
As of the end of February, prior to latest escalation of coronavirus concerns, consumers were still thinking that it was a good time to buy a house. The index still remains at a historical high of 92.5, despite dipping by 0.5 point in February.
The index values are consistent with the strong housing market performance over the last year, with the monthly rate of housing starts averaging over 1.5 million in the three months ended in January. In the same three-month period ended January 2019, starts averaged a rate of just 1.2 million units.
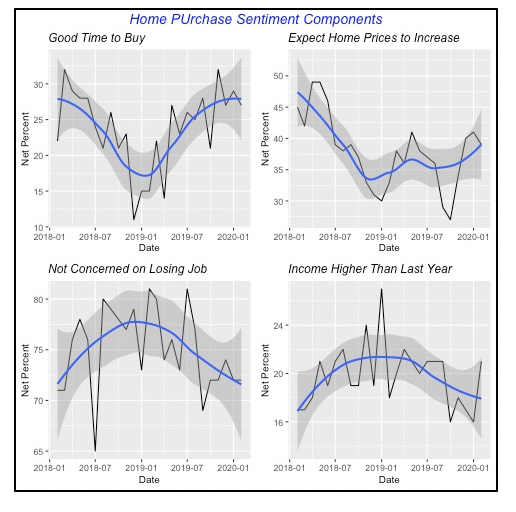
The index is a summary of consumers’ opinions on six areas, four of which are shown in the chart below. Last month’s decline in the overall index is driven mainly by a modest deterioration in their opinion that now is a “good time to buy a home.” The other factors were positive at the end of February but, naturally, this opinion is expected to change dramatically this month, when the survey will capture the impact of the most recent Coronavirus news and events.
Mortgage Rates Remain Favorable
Although the 30-year, fixed mortgage rate rose by seven basis points last week (0.07%), to 3.36%, it remains well in a range favorable to appeal to potential home buyers or remodelers. Further, given Sunday’s move by the central bank to lower the Federal Funds rate to a range between 0% and 0.25%, and its move to push $700 billion into the economy, mortgage rates will likely drop again.
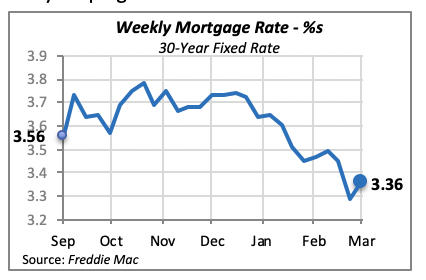
However, despite the Fed’s best intentions to boost the economy through these moves, it will take some time for the lower interest to have an appreciable impact in the “real” economy. Unlike the reaction of the stock markets, where buying and selling is almost instantaneous, businesses and consumers in the “real” economy take time to react and adjust to any new, changing situation.
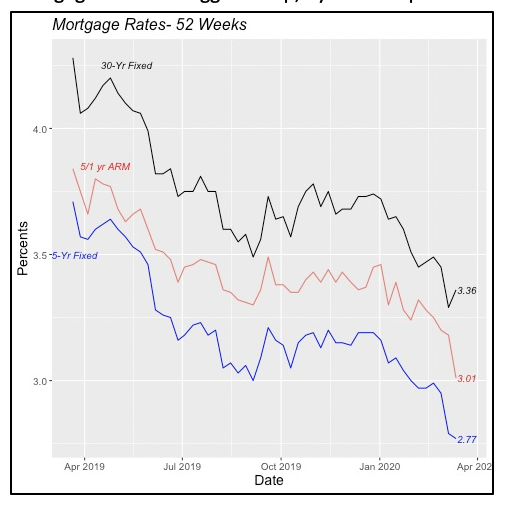
Also, while the 30-year fixed rate rose last week, two alternate ways to mortgage a home — the 15-year fixed-rate loan and adjustable-rate loans — actually fell last week. Adjustable-rate mortgages had the biggest drop, by 17 basis points to 3.01%.
Manuel Gutierrez, Consulting Economist to NKBA
Explanation of NKBA’s Economic Indicators Dashboard
The dashboard displays the latest value of each economic indicator with a colored triangle that highlights visually the recent trend for each of the drivers. “Green” is a positive signal, indicating that the latest value is improving; “Yellow,” as it’s commonly understood, denotes caution because the variable may be changing direction; “Red” indicates that the variable in question is declining, both in its current value and in relation to the recent past.
Note that all the data, except for “mortgage rate” and “appliance-store sales” are seasonally adjusted and are represented at annual rates.
Remodeling Expenditures. This is the amount of money spent on home improvement projects during the month in question. It covers all work done for privately owned homes (excludes rentals, etc.). The data are in billions of dollars and are issued monthly by the U.S. Department of Commerce.
Single-Family Starts. This is the number of single-family houses for which construction was started in the given month. The data are in thousands of houses and are issued monthly by the U.S. Department of Commerce.
Existing-Home Sales. These data are issued monthly by the National Association of Realtors and capture the number of existing homes that were sold in the previous month.
High-End Home Sales. This series are sales of new homes priced at $500,000 and higher. The data are released quarterly by the U.S. Department of Commerce and are not seasonally adjusted. Thus, a valid comparison is made to the same quarter of prior year.
Mortgage Rate. We have chosen the rate on 30-year conventional loans that is issued by the Federal Home Loan Mortgage Corporation (known popularly as Freddie Mac.) Although there are a large number of mortgage instruments available to consumers, this one is still the most commonly used.
Employees in Residential Remodeling. This indicator denotes the number of individuals employed in construction firms that do mostly residential remodeling work.
Building-Materials Sales. These data, released monthly by the Department of Commerce, capture total sales of building materials, regardless of whether consumers or contractors purchased them. However, we should caution that the data also includes sales to projects other than residential houses.
Appliance-Store Sales. This driver captures the monthly sales of stores that sell mostly household appliances; the data are stated at an annual rate. We should not confuse this driver with total appliance sales, since they are sold by other types of stores such as home centers.
We hope you find this dashboard useful as a general guide to the state of our industry. Please contact us at Feedback@nkba.org if you would like to see further detail.


