

More Households Become Homeowners
The percentage of households who own their homes rose to 65.1% in the last quarter, an improvement of 0.3% from the fourth quarter of 2018, when the rate stood at 64.8%. This increase in homeownership translates into nearly 1.2 million more households who are now homeowners.
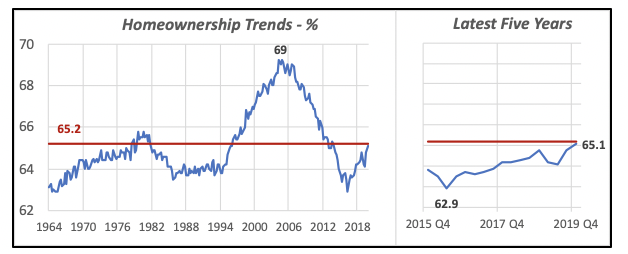
Last quarter’s gain caps four years of virtually continued increases in homeownership, starting from the second quarter of 2016, when the rate had hit bottom at 62.9%. The latest rate is virtually the same as the average since 1962, which is 65.2% and is shown as a point of reference by the red line in the chart — although the long-term average is not especially meaningful, since most of the time the rate was far from the average.
A rising homeownership rate is obviously important to many of our businesses, as homeowners tend to spend more on remodeling and maintenance of their homes than rental property owners, and naturally are more likely to select higher-quality and higher-price products for their own homes. A rising rate generally bodes well for NKBA members. Over the last year, the number of homeowners increased by 1.3 million; these newer homeowners typically will engage in remodeling and upgrading their homes in the near future.
Regionally, the lowest rates of homeownership are in the Northeast and the West. In both areas, a large proportion of households are renters living in the central cities of large metropolitan areas. In the Northeast, for instance, about two-thirds of the households within the New York metropolitan area are renters.
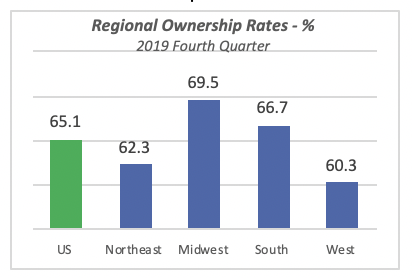
Conversely, the highest homeownership rate is in the Midwest, a region with a preponderance of relatively small metropolitan areas where the majority of people lives in single-family houses.
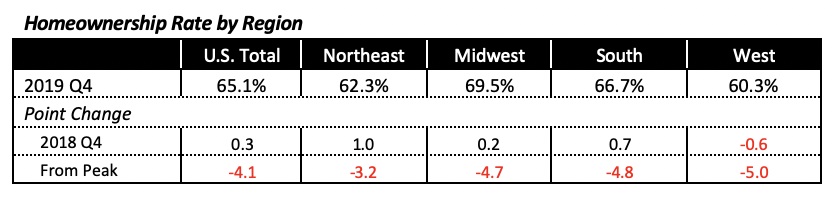
Despite the recent gains, homeownership in the U.S. and its four regions still lags far behind the peaks reached during the housing boom at the beginning of the century. But of course, we don’t need to be reminded that those high rates were attained via a number of questionable home loans, and many of those homeowners lost their homes to foreclosure because of their inability to keep up with their mortgage payments.
Employment Growth Remains Strong
Another month is in the books and thousands more people have become employed. In January, another 225,000 jobs were created, 92% of which were in the private sector.
The number of January jobs exceeds last year’s monthly average; further, it also surpasses the actual number of jobs most months in 2019, except January, which saw 269,000 new jobs, and November, when 261,000 jobs were added.
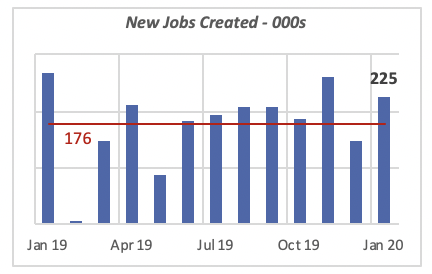
The red line in the chart, at 176,000 jobs, is the average monthly number of new jobs over the last three years.
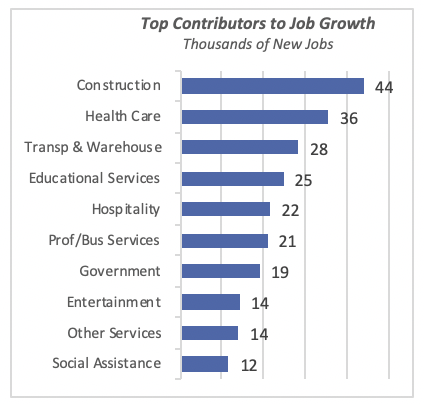
For the first time in quite a while, the Construction industry was the top contributor to job growth, adding one in five new January positions, or 44,000. Health Care was second, adding 36,000 jobs.
The 10 sectors with highest number of jobs are shown in the table below; jointly they account for 98% of all jobs created last month.
Along with strong job growth, the unemployment rate remained virtually the same, although numerically it rose to 3.6%, up from 3.5% in December. Despite this modest increase, the unemployment rate is nearly half a percentage lower than it was a year ago; it was 4% in January 2019.
In December, males and females enjoyed an identical unemployment rate (3.5%), but men saw their rate grow to 3.6% in January, while the rate for women was unchanged.
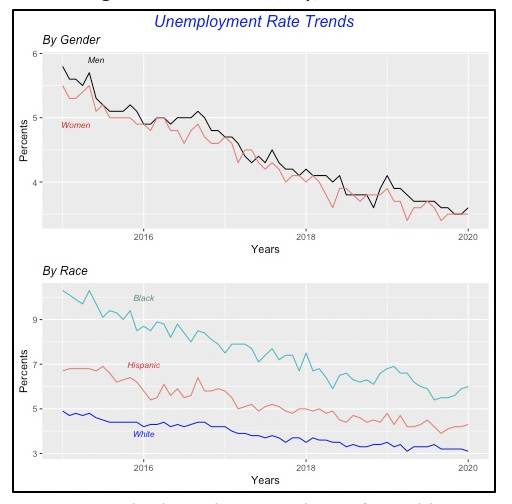
But January also brought somewhat unfavorable news among other groups. The unemployment rates for Blacks andHispanics moved slightly higher for the month. The increases were minimal, however, since for each the increase was only 0.1%, bringing the rate for Blacks up to 6% and for Hispanics to 4.3%. Both are still at historical lows.
Other aspects of employment also improved in January. For instance, the labor participation rate increased nationally to 63.4%, 0.2% above what it was a year before. The rate improved for all age groups, continuing the trend that started several years ago.
The booming economy, more jobs available and higher wages are enticing more and more people to join the labor force.
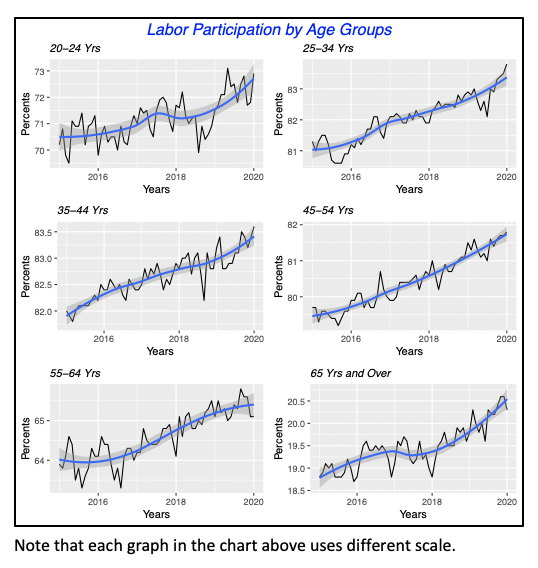
The labor participation rate had the biggest gains among individuals age 20 to 24; their rate improved by 1.5% over the last year, to the current rate of 72.9%. Persons past retirement age, that is 65 or older, also have greater participation, 24.9% in January, an increase of 0.9% actually from a year before.
Unfortunately, the data does not reveal the underlying reason for greater participation among retirees, whether it’s driven by economic necessity or perhaps their greater expected longevity combined with better health enables them to work longer. Whatever the reason, it’s good for the U.S. economy.
Another economic statistic that underlies the strength of the economy is the number of workers who file for unemployment, that is, workers who have lost their job and apply for unemployment benefits.
The number of claims in February’s first week were just 212,000 (four-week average), which is below the average of 217,000 in the previous 52 weeks. The number of claims are at historical lows, comparable to what they were in the late 1960s, when these data began to be published.
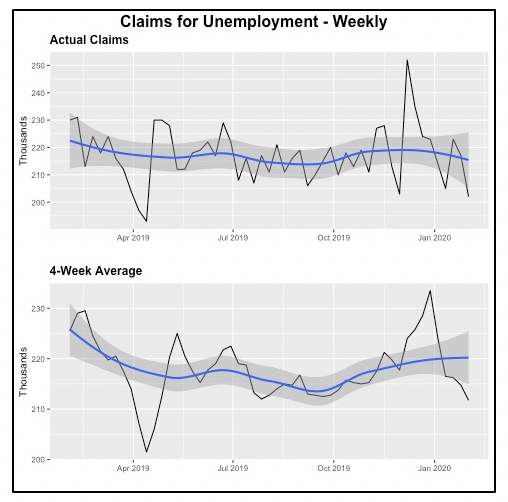
The low number of claims is also remarkable, considering that today’s labor force of approximately 165 million is almost twice as large as what it was back in the late 1960s.
As a reference, the unemployment claims data is “actual” data reported by the government. That is, it reflects the actual number of people who apply for unemployment benefits. In contrast, the vast majority of the data issued by the government, both Federal and State, is the result of statistical estimation based on surveys from a partial number of participants. Some of the surveys use very large samples, such as those used to calculate the new jobs and unemployment data that are based on approximately 60,000 households every month, but the final figures are estimates, not actual.
Construction Spending Is Stable
Total private construction remained virtually unchanged in December, falling by just 0.1% to an annual rate of $991 billion, although compared to a year ago, construction spending is up 2.9%.
The modest decline in construction is driven by the non-residential sector, which fell by 1.8% for the month, while total residential was actually up 1.4%. Residential construction accounts for over half (55%) of total construction spending in a given month.
Within the residential sector, both single-family and homeowner remodeling increased in December, but spending for multifamily housing actually declined.
Spending for single-family houses increased steadily over the last half of the year, to reach an annual pace of $289 billion, up 2.7% from the prior month but still below the peak spending attained in early 2018.
Similarly, spending by homeowners for remodeling their houses also rose in December, although by a minimal 0.5% to an annual rate of $194 billion.
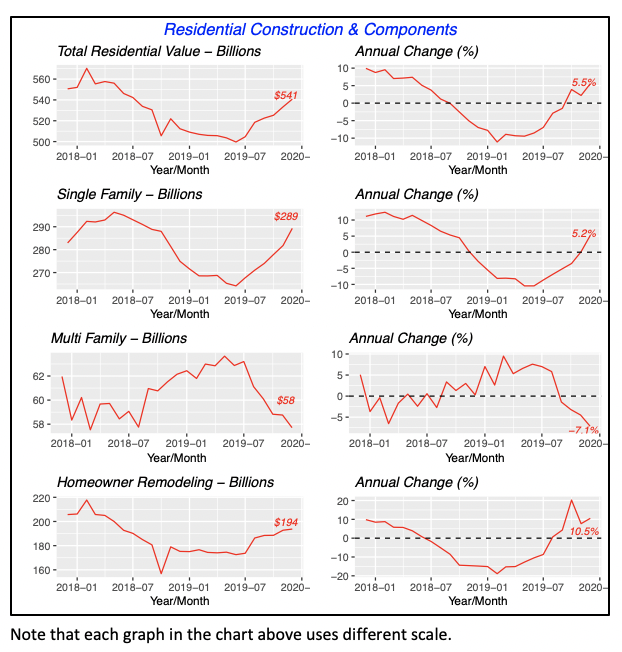
Multifamily construction, on the other hand, fell by almost 2% last month, and is running more than 7% below its level of a year ago.
Mortgage Rates Continue to Slide
Last week brought another decline in mortgage rates, with the key 30-year fixed rate falling by six basis points to 3.45%. This is the lowest that mortgage rates have been since late 2016.
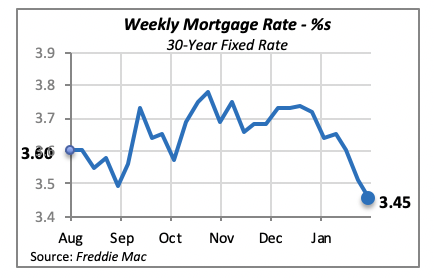
Of course, such rates are favorable and encourage consumers to borrow funds to perhaps finance a home remodel, or entice others to purchase a home. However, we cannot tell simply from falling rates whether the underlying reason is a decline in the demand for mortgages.
Manuel Gutierrez, Consulting Economist to NKBA
Explanation of NKBA’s Economic Indicators Dashboard
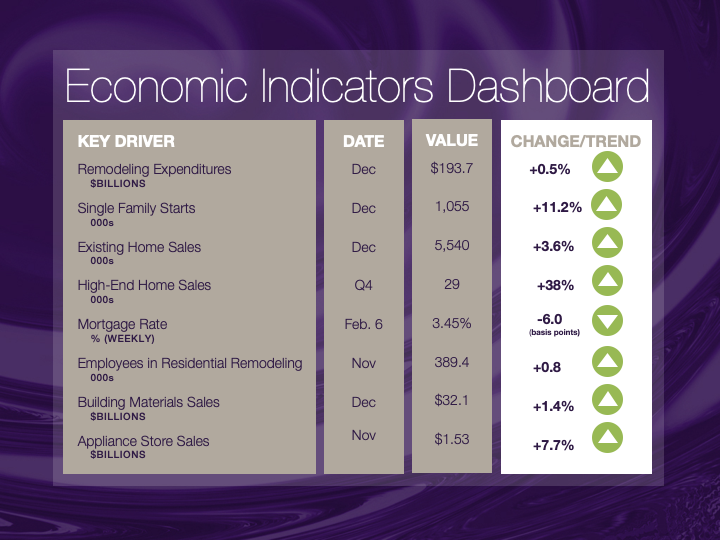
The dashboard displays the latest value of each economic indicator with a colored triangle that highlights visually the recent trend for each of the drivers. “Green” is a positive signal, indicating that the latest value is improving; “Yellow,” as it’s commonly understood, denotes caution because the variable may be changing direction; “Red” indicates that the variable in question is declining, both in its current value and in relation to the recent past.
Note that all the data, except for “mortgage rate” and “appliance-store sales” are seasonally adjusted and are represented at annual rates.
Remodeling Expenditures. This is the amount of money spent on home improvement projects during the month in question. It covers all work done for privately owned homes (excludes rentals, etc.). The data are in billions of dollars and are issued monthly by the U.S. Department of Commerce.
Single-Family Starts. This is the number of single-family houses for which construction was started in the given month. The data are in thousands of houses and are issued monthly by the U.S. Department of Commerce.
Existing-Home Sales. These data are issued monthly by the National Association of Realtors and capture the number of existing homes that were sold in the previous month.
High-End Home Sales. This series are sales of new homes priced at $500,000 and higher. The data are released quarterly by the U.S. Department of Commerce and are not seasonally adjusted. Thus, a valid comparison is made to the same quarter of prior year.
Mortgage Rate. We have chosen the rate on 30-year conventional loans that is issued by the Federal Home Loan Mortgage Corporation (known popularly as Freddie Mac.) Although there are a large number of mortgage instruments available to consumers, this one is still the most commonly used.
Employees in Residential Remodeling. This indicator denotes the number of individuals employed in construction firms that do mostly residential remodeling work.
Building-Materials Sales. These data, released monthly by the Department of Commerce, capture total sales of building materials, regardless of whether consumers or contractors purchased them. However, we should caution that the data also includes sales to projects other than residential houses.
Appliance-Store Sales. This driver captures the monthly sales of stores that sell mostly household appliances; the data are stated at an annual rate. We should not confuse this driver with total appliance sales, since they are sold by other types of stores such as home centers.
We hope you find this dashboard useful as a general guide to the state of our industry. Please contact us at Feedback@nkba.org if you would like to see further detail.


