

New Residential Construction Closes 2019 Strong
New housing construction ended the year 2019 with a bang. Housing starts jumped 41% in December to a seasonally adjusted 1.6 million units (annualized rate), with both single-family and multifamily starts contributing to the increase. Single-family housing starts rose 30% to an annualized rate of 1.06 million units, while construction of multifamily units also increased, to a rate of 553,000 units — a 69% jump.

But, as the old saying goes “one month doesn’t make a trend.” December’s jump in housing starts did not improve the annual total noticeably, although with the December result, total housing starts for the year are more than 3% above 2018. This result is better than the previous expectation for a flat year, compared to 2018.
It is doubtful that December’s rate of new housing construction will be maintained at the same pace in the next few months. Typically, December housing starts are approximately 20% lower than November starts, and as such, December data is normally adjusted upward by roughly 20%. It’s likely that the atypically warm weather across the country in December may have played a significant part, allowing builders to start building more houses than when weather is colder.
However, as the chart above suggests, even excluding December’s data, construction of new houses has followed a rising trend since the beginning of 2019. In addition, the more favorable economic climate from the trade agreements signed recently with China should boost consumer and business confidence.
On a regional basis, that last year’s national increase in housing construction does not translate across all regions. New housing starts actually fell in two of the regions — the Midwest, which fell by just under 1%, and the West, with a nearly 5% drop.

Consumer Prices Edge Up
Consumer prices overall rose by 0.2% in December, but were 2.3% higher than a year before. In contrast, the Core CPI, which excludes highly volatile items like food and energy products, rose by just 0.1%. On an annual basis, the Core CPI increased less than the overall prices (“All Items” in the chart) for the first time in a year.
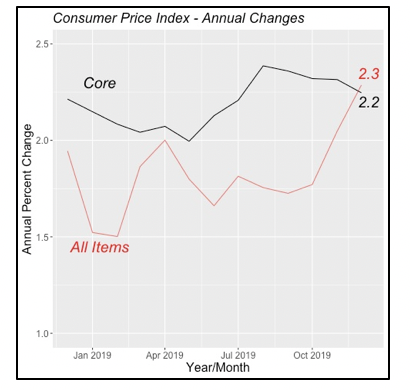
Inflation remains tame, and expectations are that it will continue the same pattern over the year ahead. Consumers, according to the University of Michigan’s survey, actually expect inflation rates to fall in the future.
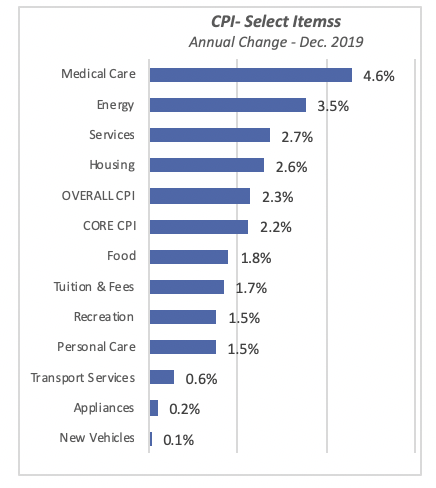
The major categories driving recent inflation, and in December’s report, are Medical Care, rising 4.6% over the last 12 months, and Energy, which rose 3.5% last year. Another major group whose inflation rate is above average is Services, which excludes all goods-producing industries such as food or automobiles. Services has risen by 2.7% since December 2018.
Long-Term Inflation: Education and Medical Care Lead
On a long-term basis, consumer prices overall have increased at an annual rate of 3.2% since the early 1980s. But Tuition and Fees, labeled “Education” in the chart below, has risen the highest with an annual average of 6.7%. Another item with a substantial historical inflation rate, as many painfully know, is Medical Care, with an annual average of 5.2% over the last 40 years.
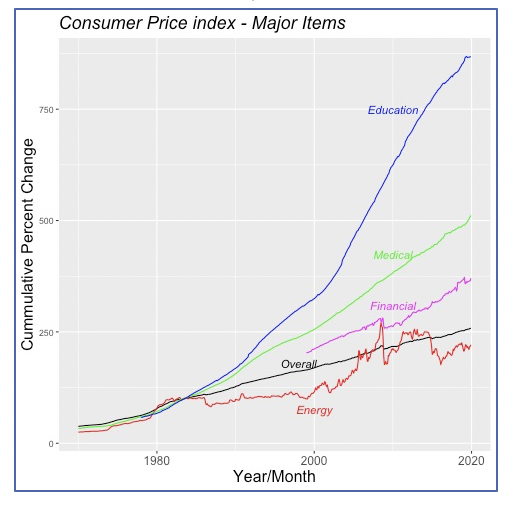
Energy inflation has been fairly tame, with an annual average increase of 3.7% since the 1980s — slightly higher than the overall inflation rate of 3.2%. In fact, as can be seen in the chart above, Energy inflation has been lower than overall inflation with an average of 1.6% since 2010, compared to 1.8% annual average for all items combined — the overall Consumer Price Index. The low Energy inflation rate has been impacted, no doubt, by the large increases in domestic oil production brought about by the introduction of fracking techniques.
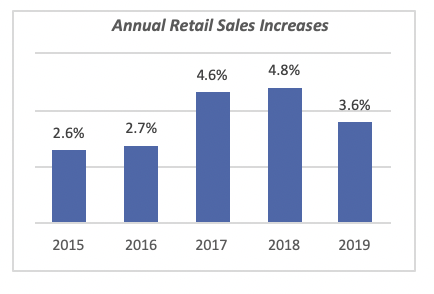
Retail Sales Rise Slightly in December
Total retail sales rose by 0.3% in December, about the same increase as in the preceding two months (see the bottom-left graph in the chart below). The latest data shows, however, that sales grew less than the previous 12 months, when sales rose an average of 0.5%.
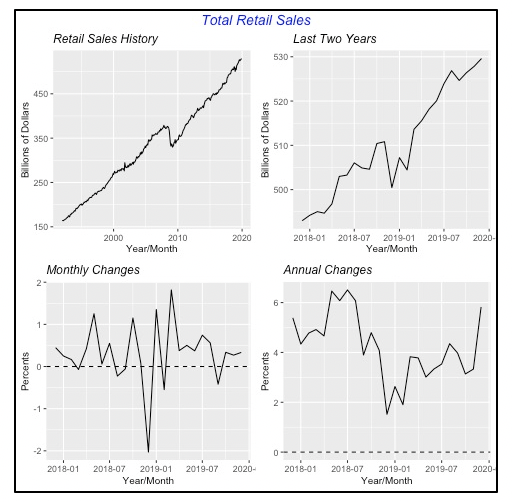
Compared to a year before, retail sales in December 2019 were nearly 6% higher than those of December 2018, when retail sales actually fell by 2%. Further, on a yearly basis, 2019 had the lowest rate of sales increase since 2016.
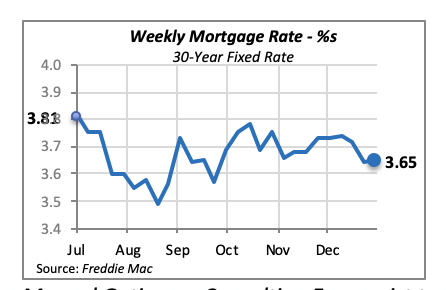
Interest Rates Remain Virtually Unchanged
Although the 30-year fixed mortgage rate moved up by one basis point last week to reach 3.65%, this minimal change is immaterial and is note expected to discourage consumers from borrowing funds for house construction or home purchases.
Manuel Gutierrez, Consulting Economist to NKBA
Explanation of NKBA’s Economic Indicators Dashboard
The dashboard displays the latest value of each economic indicator with a colored triangle that highlights visually the recent trend for each of the drivers. “Green” is a positive signal, indicating that the latest value is improving; “Yellow,” as it’s commonly understood, denotes caution because the variable may be changing direction; “Red” indicates that the variable in question is declining, both in its current value and in relation to the recent past.
Note that all the data, except for “mortgage rate” and “appliance-store sales” are seasonally adjusted and are represented at annual rates.
Remodeling Expenditures. This is the amount of money spent on home improvement projects during the month in question. It covers all work done for privately owned homes (excludes rentals, etc.). The data are in billions of dollars and are issued monthly by the U.S. Department of Commerce.
Single-Family Starts. This is the number of single-family houses for which construction was started in the given month. The data are in thousands of houses and are issued monthly by the U.S. Department of Commerce.
Existing-Home Sales. These data are issued monthly by the National Association of Realtors and capture the number of existing homes that were sold in the previous month.
High-End Home Sales. This series are sales of new homes priced at $500,000 and higher. The data are released quarterly by the U.S. Department of Commerce and are not seasonally adjusted. Thus, a valid comparison is made to the same quarter of prior year.
Mortgage Rate. We have chosen the rate on 30-year conventional loans that is issued by the Federal Home Loan Mortgage Corporation (known popularly as Freddie Mac.) Although there are a large number of mortgage instruments available to consumers, this one is still the most commonly used.
Employees in Residential Remodeling. This indicator denotes the number of individuals employed in construction firms that do mostly residential remodeling work.
Building-Materials Sales. These data, released monthly by the Department of Commerce, capture total sales of building materials, regardless of whether consumers or contractors purchased them. However, we should caution that the data also includes sales to projects other than residential houses.
Appliance-Store Sales. This driver captures the monthly sales of stores that sell mostly household appliances; the data are stated at an annual rate. We should not confuse this driver with total appliance sales, since they are sold by other types of stores such as home centers.
We hope you find this dashboard useful as a general guide to the state of our industry. Please contact us at Feedback@nkba.org if you would like to see further detail.


