

Positive Employment News Leads November Stats
Tremendous news on the employment front this month, as 266,000 jobs were created in November. This is more than 100,000 over the amount added in October, and the second-highest month in the past year. Further, the number of new jobs for the two preceding months was increased by 41,000 from the previous estimate.
The majority of these jobs — 95% — were created in the private sector. Note that the data are “seasonally adjusted,” which means that the figures have been adjusted for the pre-holiday hiring surge that occurs every year.
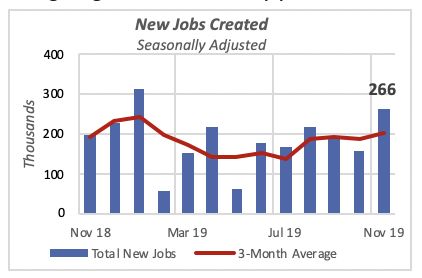
The unemployment rate moved down to 3.5% for the month, a minimal 0.1% from October, but matching the low rate of September. As reported, the last time there was an equally low rate was a half-century ago, in mid-1969.
While overall the news is positive, it should be noted that year-to-date, new jobs are still 19% below last year.
Labor participation, that is the number of persons who are either employed or currently unemployed but looking for work as a percent of the total working-age population, fell modestly to 63.2%. The overall rate had been declining since the turn of the century, after reaching a peak of 67.2% in mid-1997; afterwards declining slowing until the 2007-09 recession when it fell by about 2%. The rate was relatively flat until late last year, when more people began to participate again in the labor force.
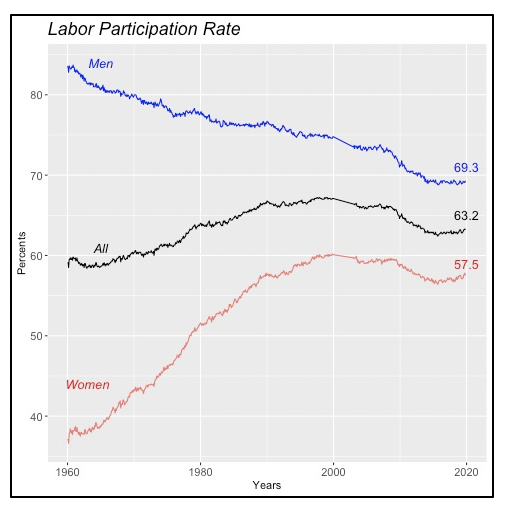
Males’ Participation in the Labor Force Falls
The chart above displays the overall participation rate among all workers (black line), as well as that for males (blue line) and females (red line). Note that the total participation rate rose between 1960 and 2000 owing to the greater number of women who joined the labor force during those 40 years. The women’s participation rate rose from 37% in early 1960 to 60% by 2000. This growth compensated for the secular decline in male participation, that fell from just under 84% in the early Sixties, to the current 69.3% — a plunge of 15%.
To date there is no clear explanation for the decline in male participation. Among the reasons given, and there is some research supporting them, are that males simply have become inactive voluntarily or that injuries and deteriorating general health have forced them to quit the labor force. Another possible reason is changing skill levels required for specific jobs, which might have a greater impact on younger people. Plus, factors such as ethnic or race origin and education play a role in driving the lower male participation rate.
We can see in the chart below that male participation has declined for all age groups since 1960. However, for males 45 years or older, the rate reversed course in the mid-1990s. The increase in the percentage of retirement-age persons who remain in, or re-enter, the labor force is perhaps paradoxical. They are opting to continue working after they reach retirement age, not necessarily in their previous career, for a variety of reasons.
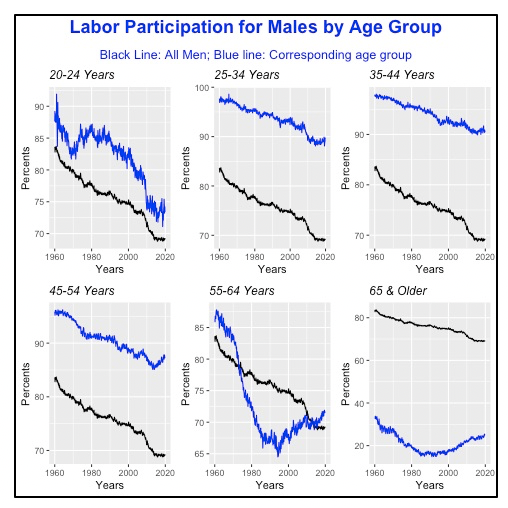
In some cases, the changes in Social Security retirement age — which has increased to the current 67 years — induces people to continue working, since waiting to this age allows them to collect full benefits. Other reasons could be the fact that people are healthier and live longer, or simply, that the need the money.
Construction Spending Continues Slide
Spending for construction of private projects fell by 1% in October to an annual rate of $956 billion. October’s decline follows a 1.1% contraction in the previous month, and, in fact, total spending has fallen in six of the 10 months so far this year.
Compared to the same month last year, spending is running at a 1.8% slower pace. Every month throughout this year, spending has been below the corresponding month of 2018. This can be seen in the lower-left graph, which displays the annual percent change for the last two years, where it has been below the zero change dash-line since November 2018.
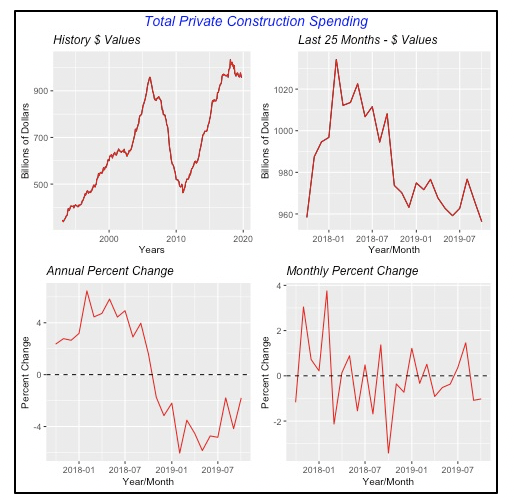
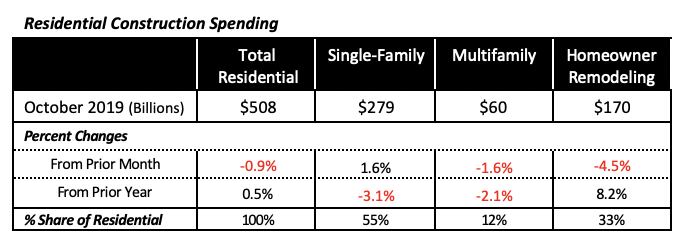
Both major components of the construction market, residential and non-residential, helped drive the overall 1% decline. Residential was down 0.9% in October, to an annual rate of $508 billion, and non-residential dropped by a slightly higher 1.2% to $448 billion (annualized).
On an annual comparison basis, the picture that emerges is a little different because residential construction is up 0.5% in October from a year ago, while non-residential is down 4.3%. The two bottom graphs in the chart below display these annual percentage changes for the last 25 months.
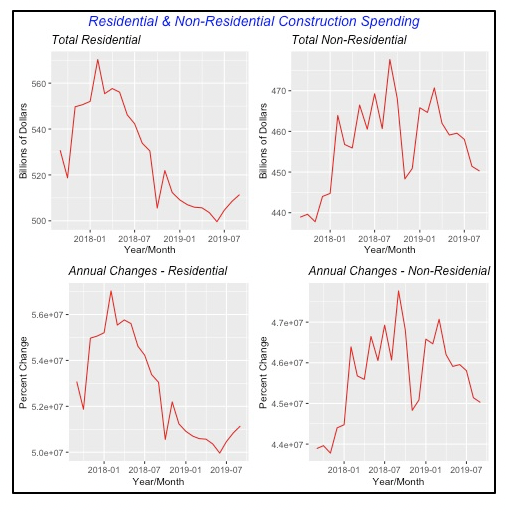
Within the residential sector, while single-family construction spending has been increasing for the last three months, both multifamily and homeowner remodeling have declined pretty much over the same period. Were it not for the gains in single-family construction over the last few months, total residential construction would be down even more.
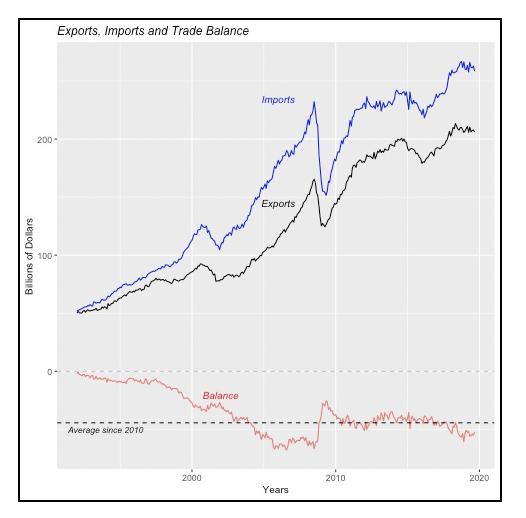
Foreign Trade Deficit Improves
The foreign trade situation improved slightly in October, by 4.7%, for a deficit of $53 billion for the month. The improving deficit was the result of a decline in the “goods” balance, which was helped by a $4.5 billion drop in U.S. imports, even though our exports also fell, but by a smaller $1.8 billion.
At the same time, the “services” balance fell modestly by 0.6%, or just under $100 million. The U.S. traditionally exports more in services than it imports, resulting in a favorable balance.
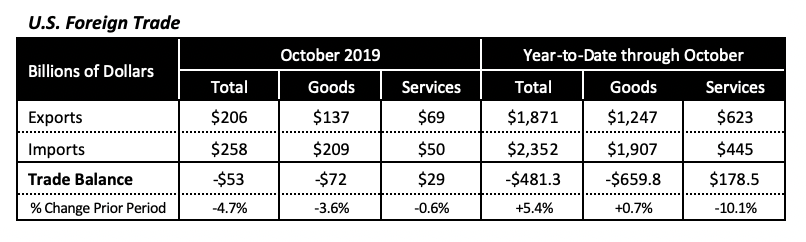
The chart below shows that the trade balance hovered around the $45 billion mark until the middle of last year, when it worsened to above $50 billion, the result of the imposition of tariffs on Chinese goods and that nation’s ensuing retaliation.
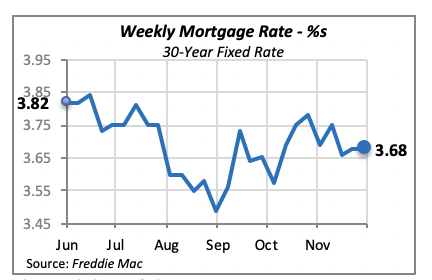
Interest Rates Stay Flat
Mortgage rates did not move at all last week; the 30-year, fixed rate remained at 3.68%. The Chairman of the Federal Reserve Bank very nearly gave a signal that the Fed will not raise rates in the near future, since the governors do not see inflation rising.
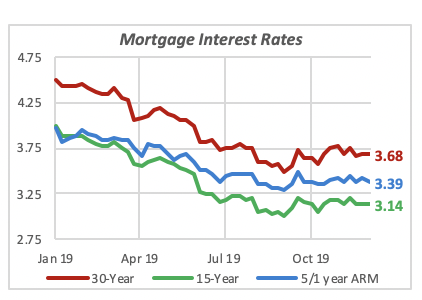
The stability of the 30-year mortgage rate is paralleled by other mortgage rates, such as the 15-year fixed rate, as well as the 5- and 1-year rates. The three rates are depicted in the chart below, which shows the plateau they have reached since July, after falling by approximately 1% in the first half of 2019.
Manuel Gutierrez, Consulting Economist to NKBA
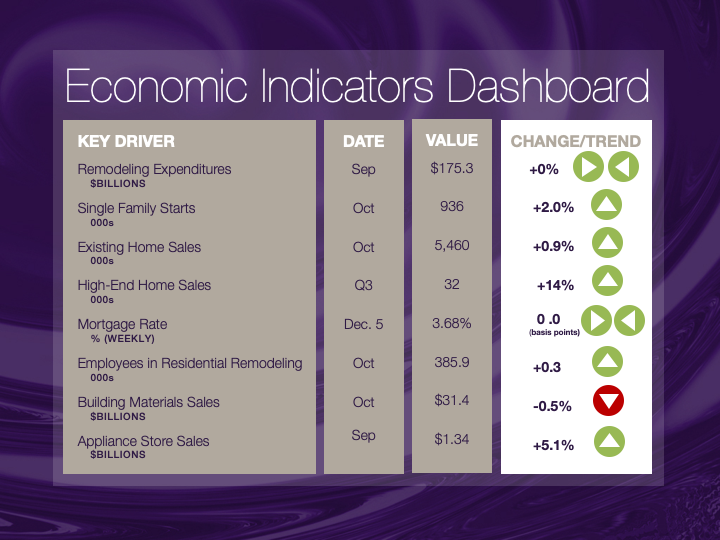
Explanation of NKBA’s Economic Indicators Dashboard
The dashboard displays the latest value of each economic indicator with a colored triangle that highlights visually the recent trend for each of the drivers. “Green” is a positive signal, indicating that the latest value is improving; “Yellow,” as it’s commonly understood, denotes caution because the variable may be changing direction; “Red” indicates that the variable in question is declining, both in its current value and in relation to the recent past.
Note that all the data, except for “mortgage rate” and “appliance-store sales” are seasonally adjusted and are represented at annual rates.
Remodeling Expenditures. This is the amount of money spent on home improvement projects during the month in question. It covers all work done for privately owned homes (excludes rentals, etc.). The data are in billions of dollars and are issued monthly by the U.S. Department of Commerce.
Single-Family Starts. This is the number of single-family houses for which construction was started in the given month. The data are in thousands of houses and are issued monthly by the U.S. Department of Commerce.
Existing-Home Sales. These data are issued monthly by the National Association of Realtors and capture the number of existing homes that were sold in the previous month.
High-End Home Sales. This series are sales of new homes priced at $500,000 and higher. The data are released quarterly by the U.S. Department of Commerce and are not seasonally adjusted. Thus, a valid comparison is made to the same quarter of prior year.
Mortgage Rate. We have chosen the rate on 30-year conventional loans that is issued by the Federal Home Loan Mortgage Corporation (known popularly as Freddie Mac.) Although there are a large number of mortgage instruments available to consumers, this one is still the most commonly used.
Employees in Residential Remodeling. This indicator denotes the number of individuals employed in construction firms that do mostly residential remodeling work.
Building-Materials Sales. These data, released monthly by the Department of Commerce, capture total sales of building materials, regardless of whether consumers or contractors purchased them. However, we should caution that the data also includes sales to projects other than residential houses.
Appliance-Store Sales. This driver captures the monthly sales of stores that sell mostly household appliances; the data are stated at an annual rate. We should not confuse this driver with total appliance sales, since they are sold by other types of stores such as home centers.
We hope you find this dashboard useful as a general guide to the state of our industry. Please contact us at Feedback@nkba.org if you would like to see further detail.


