

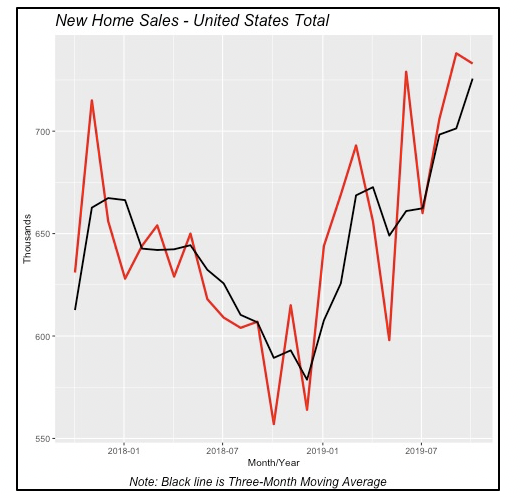
New Home Sales Slip
Sales of single-family new homes declined by a minimal 0.7% in October, to an annual rate of 733,000 units sold. Compared to a year ago, however, sales are nearly a third higher and, as seen in the chart below, October 2018 recorded the lowest level of home-sales activity over the last two years.
Sales of new homes have been increasing steadily for a year now, albeit with sharp monthly ups and downs. But the three-month moving average (the black line in the chart) captures well the underlying positive trend in new-home sales.
Despite the issues that builders face regarding labor availability — which would presumably lead to fewer sales of completed homes and more sales of houses promised to be built in the future (i.e., homes sold but not started yet) — the data does not show an increase in the number of sales of homes not yet started. In fact, the proportion of homes sold that have not been started is 28% so far this year, which is lower than the 31% average of the last five years.
This suggests that builders are able to keep up with demand, and supply consumers with completed homes as they desire.
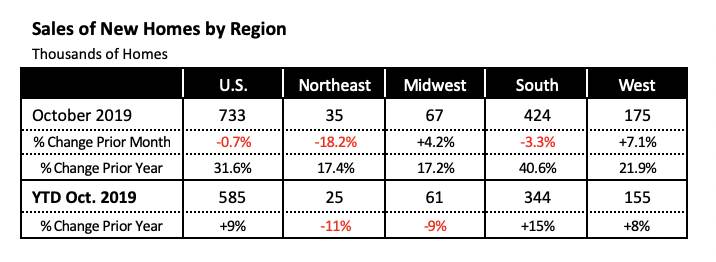
Sales Strength Originates in the South
Similar to construction of new homes, the South also dominates in the sale of new homes.
The national decline in October new-home sales results from declines in two of the regions, the Northeast (down 18%) and the South (down 3.3%.) These declines were compensated by increases in the Midwest (up 4%) and the West (up by 7%.)
But compared to last year, the picture that emerges is quite different. Sales were just under 32% above last year overall, with all four regions contributing positively to this result. Most importantly, the region with the largest gain is the South, which is ahead of the October 2018 sales pace by nearly 41%. This accounts for nearly 60% of total sales of new homes in the U.S.
Further, year-to-date sales are up 9% nationally, but 15% higher in the South and 8% in the West region.
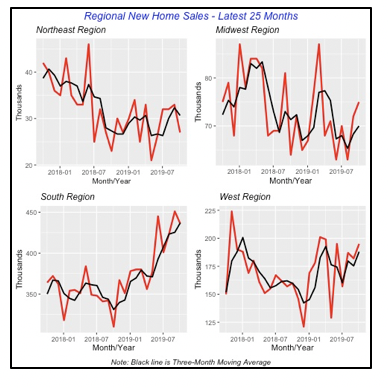
The contribution of the South to national sales can be seen more clearly in the chart below, which displays sales of new single-family homes in each of the four regions for the last 25 months.
Sales in the Northeast and the Midwest have not changed much over the last year; this can be seen by the three-month moving average (black) line in the chart. The end point is not much different from what it was 12 months before.
In the West, home sales have increased, although not as much as in the South. The latter clearly shows a sharp, positive trend over the last 12 months. This is particularly evident when compared to the earlier period in the chart. The annualized rate of monthly sales increases virtually in every month.
Home Prices Hold Steady
House prices appear to have stabilized to a rate slightly above 3%. For September, the Case-Shiller home price index was 3.2% above last year, just a shade above the 3.1% seen in August. In fact, home-price increases have ranged around 3.1% to 3.2% over the last four months. A year ago, they were running over a 5% pace.
The recent cooling of house prices bodes well for prospective home buyers. The purchase of a home may be valued more for the shelter that it provides than its future value as an asset. Of course, the asset value should not be dismissed, but a stress on it solely is what brought the home-buying frenzy of the first decade of this century, resulting in millions of consumer bankruptcies and homes foreclosed.

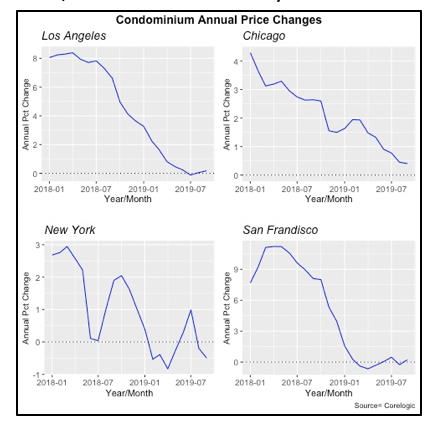
Condominium Prices Barely Rise
Corelogic, the company that compiles data to calculate the Case-Shiller home-price index, also provides data on prices of condominiums. However, because the number of condo sales in many cities is relatively small, Corelogic only provides such data for five metropolitan areas, four of which are shown in the chart below. (To request information on the Boston area, contact info@nkba.org)
Condo prices have been slow to rise, to nearly no increase recently. In fact, condo prices in New York have actually fallen the last few months, and in the other three metro areas depicted in the chart, the increases are barely above zero.
Manufacturing: Employment, Shipments and Orders
A vital sector in the U.S. economy is manufacturing, which nationally accounts for nearly 10% of all jobs. Although hourly wages in manufacturing are slightly below the national average for all industries, the benefits to workers in this sector more than compensate for the difference.
But the recent trade war with China has resulted in a decline of manufacturing output over the last year or so, with the consequent declines in employment and shipments. Total manufacturing shipments have fallen in the last three months ended in September, and have actually declined in seven of the last 12 months. The steady increases in shipments seen since early 2017 turned into declines a year ago, so September’s shipments were actually below their levels of the year before.
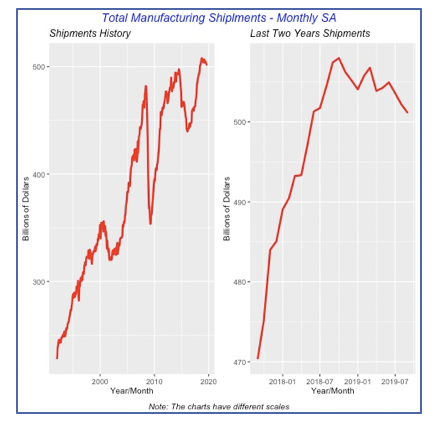
Total shipments fell in September by 0.2% to $501 billion — this is the third consecutive monthly decline in shipments. Compared to a year ago, shipments are 1.2% lower.
The shipments decline is fairly general across most industry sectors, with some exceptions, although they are relatively unimportant within total manufacturing. Primary Metals manufacturing increased in September, jumping 1.3% for the month to $20 billion. Heavy Duty manufacturing also increased, by 1.1% to $3 billion.
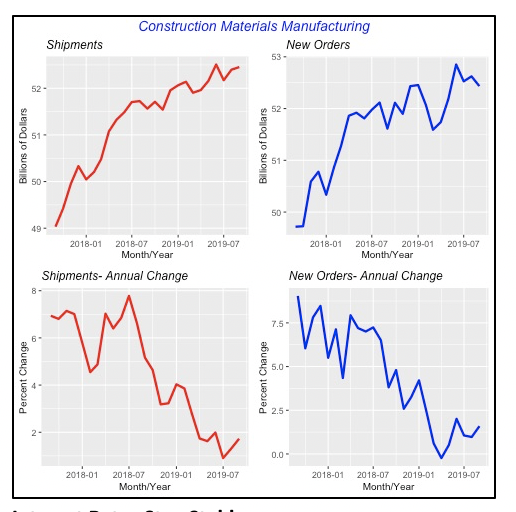
But manufacturing of Construction Materials & Suppliers, important to our industry and one that represents one of every 10 manufacturing dollars, actually rose in September. Although by a nearly negligible 0.1% to $52 billion for the month, it comes after an increase in August of 0.4%.
However, as the chart below shows, new orders for Construction Materials & Supplies has fallen in two of the last three months.
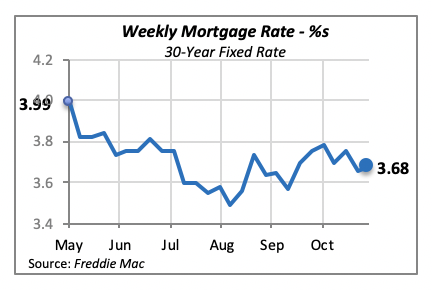
Interest Rates Stay Stable
Mortgage rates remained virtually unchanged last week, rising by just two basis points to 3.68%. Such an increase can’t be expected to have any impact on the housing markets in the near future. In fact, the 30-year, fixed mortgage rate has remained relatively stable since late June.
Manuel Gutierrez, Consulting Economist to NKBA
Explanation of NKBA’s Economic Indicators Dashboard
The dashboard displays the latest value of each economic indicator with a colored triangle that highlights visually the recent trend for each of the drivers. “Green” is a positive signal, indicating that the latest value is improving; “Yellow,” as it’s commonly understood, denotes caution because the variable may be changing direction; “Red” indicates that the variable in question is declining, both in its current value and in relation to the recent past.
Note that all the data, except for “mortgage rate” and “appliance-store sales” are seasonally adjusted and are represented at annual rates.
Remodeling Expenditures. This is the amount of money spent on home improvement projects during the month in question. It covers all work done for privately owned homes (excludes rentals, etc.). The data are in billions of dollars and are issued monthly by the U.S. Department of Commerce.
Single-Family Starts. This is the number of single-family houses for which construction was started in the given month. The data are in thousands of houses and are issued monthly by the U.S. Department of Commerce.
Existing-Home Sales. These data are issued monthly by the National Association of Realtors and capture the number of existing homes that were sold in the previous month.
High-End Home Sales. This series are sales of new homes priced at $500,000 and higher. The data are released quarterly by the U.S. Department of Commerce and are not seasonally adjusted. Thus, a valid comparison is made to the same quarter of prior year.
Mortgage Rate. We have chosen the rate on 30-year conventional loans that is issued by the Federal Home Loan Mortgage Corporation (known popularly as Freddie Mac.) Although there are a large number of mortgage instruments available to consumers, this one is still the most commonly used.
Employees in Residential Remodeling. This indicator denotes the number of individuals employed in construction firms that do mostly residential remodeling work.
Building-Materials Sales. These data, released monthly by the Department of Commerce, capture total sales of building materials, regardless of whether consumers or contractors purchased them. However, we should caution that the data also includes sales to projects other than residential houses.
Appliance-Store Sales. This driver captures the monthly sales of stores that sell mostly household appliances; the data are stated at an annual rate. We should not confuse this driver with total appliance sales, since they are sold by other types of stores such as home centers.
We hope you find this dashboard useful as a general guide to the state of our industry. Please contact us at Feedback@nkba.org if you would like to see further detail.


