

Robust Employment Growth in Private Sector
October was another relatively strong month for job growth, with a net total of 128,000 new jobs created. The private sector added slightly over 131,000 jobs while government jobs fell by 3,000. The employment report for October was favorable across all areas.
Hourly earnings are 3.5% above last year, the same rate of increase as recorded over the last four months. Similarly, the number of weekly work hours remained at 34.4, pretty much where they’ve been so far this year. Also, the labor participation rate increased to 63.3%; participation has increased by half a percentage point over the last five months.
Moreover, the estimate for the number of jobs added in the previous two months was revised upwards by 95,000 jobs. In other words, employment in the preceding two months was 95,000 jobs greater than initially estimated. The September figure spiked from 136,000 to a current estimate of 180,000, and the August figure rose from 168,000 to the current 219,000 jobs.
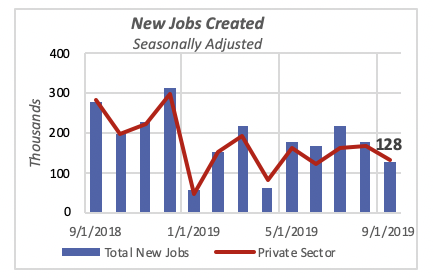
Since January, an average of 167,000 jobs have been added each month, for a year-to-date total of 1.67 million new jobs. The U.S. is set to exceed 2 million jobs this year, although the year-to-date figure is lower than the 2.26 million jobs created in the first 10 months of 2018.
Job growth was boosted by a remarkably strong addition of 53,000 jobs in the Hospitality industry, accounting for 42% of all the new jobs. Other areas of strong growth were Professional & Business Services, up by 22,000 jobs, or 17% of October’s total new jobs, and Social Assistance, which rose by 20,000 jobs , for 15% of the total.
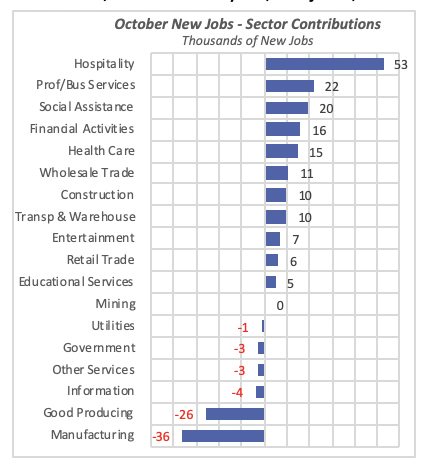
Curiously, total Government jobs fell by 3,000 in October; lead by a 17,000-job decline in Federal Government new hires, despite the need of additional workers for the 2020 Census. In fact, because of the low unemployment rate and low number of persons unemployed, the Federal government has had a hard time finding workers to fill those Census positions. And the situation will only get worse as the deadline approaches.
Employment in the Manufacturing sector fell the most in October, with a reduction in employment of 36,000 jobs. This is the second consecutive month when manufacturing employment fell, following a period of minimal growth with only 2,000 to 3,000 jobs added on average each month. Unquestionably, the trade disputes with China and other countries are having a negative short-term impact on manufacturing, although the final outcome is still far from clear.
Construction Spending Rises
Private construction spending for September reached an annual rate of $962 billion, up slightly —0.2% — from the previous month. In fact, construction spending has hovered around a rate of $960 billion for the last five months, as illustrated in the chart below, which displays the last 25 months of data.
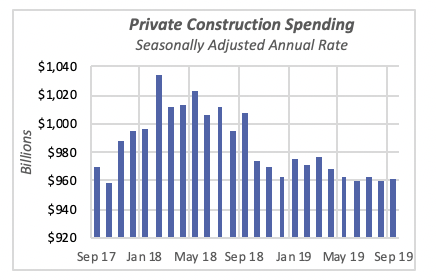
Spending in September is thus approximately 5% below the $1 trillion mark set in the first half of last year, when spending exceeded that pace for several months.
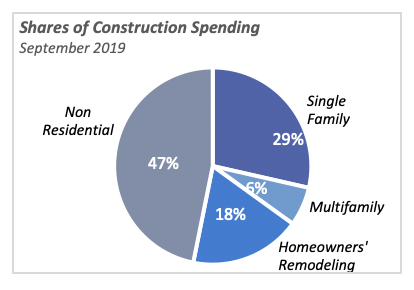
For the month of September, residential construction spending rose by 0.6% to a rate of $511 billion, negated by a 0.2% drop in non-residential spending. Single-family construction boosted total residential spending by rising 1.3% to an annual rate of $275 billion, while multifamily fell 0.7% to a rate of $62 billion.
Spending by homeowners for remodeling, the third component of total residential, was unchanged in September at $175 billion (annualized rate).
The residential sector contributed more than half of the spending in September — 53% of the total. But this is approximately the same proportion it has maintained since the beginning of the recovery almost 10 years ago. Historically, prior to the 2007-2009 recession, residential spending had been closer to 60% of total private construction.
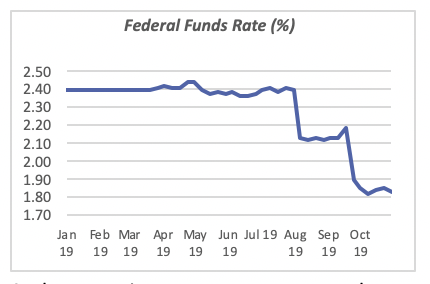
Fed Pushes Federal Funds Interest Rate Down
Last week, the Open Market Committee of the Federal Reserve Bank abruptly decided to push interest rates down further. It moved to lower the Federal Funds Rate, one of the areas it controls, to a range between 1.5% and 1.75%, from the current range of 1.75% to 2%. It expects that such a move will help boost the economy, even though such a policy of near-zero interest rates was maintained between 2009 and 2016 with no appreciable impact on economic growth.
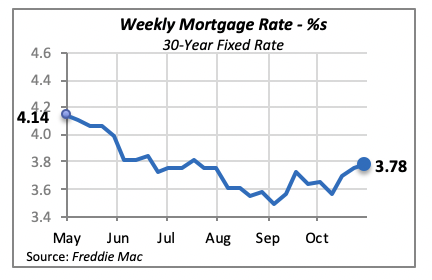
At the same time, mortgage rates rose last week, although by a modest three basis points (0.03%) to 3.78% for the 30-year, fixed mortgage rate. This increase brings the rate up to its level of just four months ago. The latest mortgage rate figure in the chart below reflects borrowing and lending activity two weeks ago, so therefore, it is not impacted by the Fed’s move to lower the Federal Funds Rate.
Manuel Gutierrez, Consulting Economist to NKBA
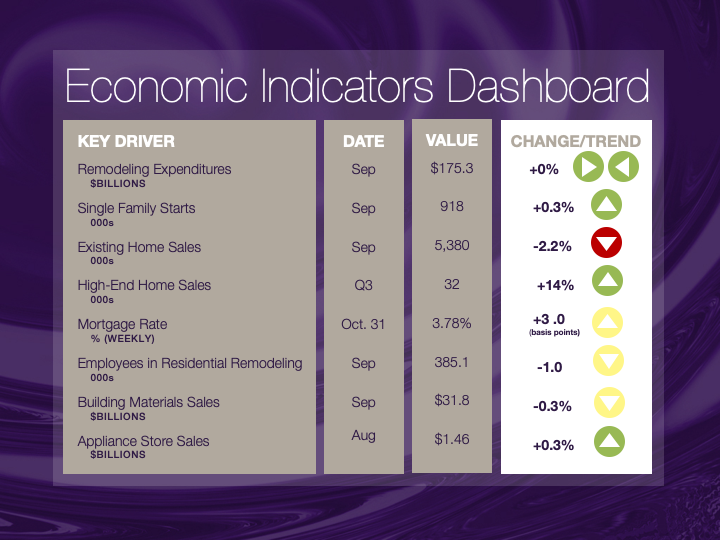
Explanation of NKBA’s Economic Indicators Dashboard
The dashboard displays the latest value of each economic indicator with a colored triangle that highlights visually the recent trend for each of the drivers. “Green” is a positive signal, indicating that the latest value is improving; “Yellow,” as it’s commonly understood, denotes caution because the variable may be changing direction; “Red” indicates that the variable in question is declining, both in its current value and in relation to the recent past.
Note that all the data, except for “mortgage rate” and “appliance-store sales” are seasonally adjusted and are represented at annual rates.
Remodeling Expenditures. This is the amount of money spent on home improvement projects during the month in question. It covers all work done for privately owned homes (excludes rentals, etc.). The data are in billions of dollars and are issued monthly by the U.S. Department of Commerce.
Single-Family Starts. This is the number of single-family houses for which construction was started in the given month. The data are in thousands of houses and are issued monthly by the U.S. Department of Commerce.
Existing-Home Sales. These data are issued monthly by the National Association of Realtors and capture the number of existing homes that were sold in the previous month.
High-End Home Sales. This series are sales of new homes priced at $500,000 and higher. The data are released quarterly by the U.S. Department of Commerce and are not seasonally adjusted. Thus, a valid comparison is made to the same quarter of prior year.
Mortgage Rate. We have chosen the rate on 30-year conventional loans that is issued by the Federal Home Loan Mortgage Corporation (known popularly as Freddie Mac.) Although there are a large number of mortgage instruments available to consumers, this one is still the most commonly used.
Employees in Residential Remodeling. This indicator denotes the number of individuals employed in construction firms that do mostly residential remodeling work.
Building-Materials Sales. These data, released monthly by the Department of Commerce, capture total sales of building materials, regardless of whether consumers or contractors purchased them. However, we should caution that the data also includes sales to projects other than residential houses.
Appliance-Store Sales. This driver captures the monthly sales of stores that sell mostly household appliances; the data are stated at an annual rate. We should not confuse this driver with total appliance sales, since they are sold by other types of stores such as home centers.
We hope you find this dashboard useful as a general guide to the state of our industry. Please contact us at Feedback@nkba.org if you would like to see further detail.


