

New Housing Starts Rise
Total housing starts increased by nearly 2% last month, to reach an annualized rate of 1.27 million units; they are also 8.5% above their level of 1.21 million attained in October 2018. In fact, dismissing the extraordinary building rate attained this past August, when total starts were running at an annual rate of 1.38 million units, the October pace is the highest since March 2018 (indicated by the red line in the top-left graph below).
Although the improvement in housing starts last month is not especially impressive, new housing starts have gradually gained, month after month. While they averaged 1.22 million in the first quarter of this year, in the latest three-month period, they’ve averaged 1.32 million units (annualized rate).
The total housing starts image below shows the positive trend in total housing starts since virtually the beginning of the year — this is highlighted by the three-month moving average (black line), that smooths out the monthly fluctuations (top-left graph).
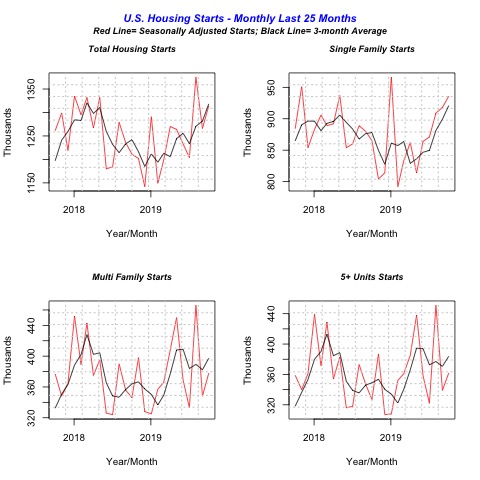
Further, by comparing the charts for Single-Family and Multifamily starts above, we can see that the rising trend in total starts is driven mostly by single-family starts, which has been improving throughout the year. Multifamily starts, on the other hand, have been relatively flat over the last five months; which can be seen in the black three-month average line in the chart above. Sharp positive jumps in a month are negated by sharp declines in the following month or months.
Note that the “5+ Units Starts” chart reflects one of the two components of the multifamily starts data, which is the combination of housing units in buildings with “2 to 4 units” and those with “5 or more units.” Small buildings with “2 to 4 units,” e.g. duplexes or triplexes, have become less popular over time; 20% of all multifamily units built in the 1980s were in buildings with two to four housing units, but today they account for less than 5%.
South Energizes New Housing
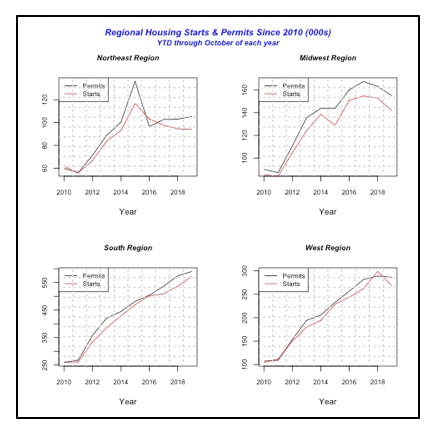
Except for the Northeast region, where housing start fell in October by 22%, regionally housing starts improved. The largest gain was in the West, where total starts jumped by 18% in October to reach an annualized rate of 361,000 units.
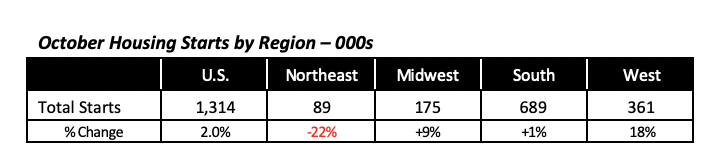
However, a better understanding can be obtained by looking at year-to-date data, shown in the table and chart below, which display regional housing starts through October.
For the most part, year-to-date housing starts are down in three of the four regions, with the exception of multifamily starts in the Northeast, which are running 18.5% ahead of last year. However, they represent a minimal part of the U.S. total.
The South is the only robust region this year for both types of housing, single-family and multifamily. Overall, year-to-date starts in the South are nearly 7% ahead of last year; both single- and multifamily contribute to this gain.
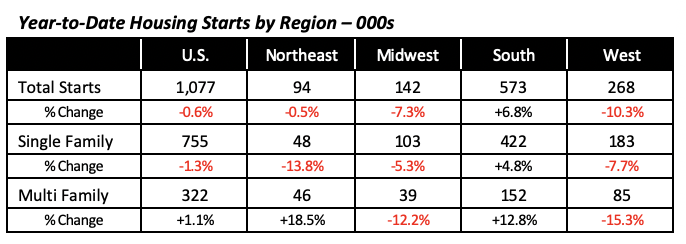
But more interesting is the fact that the South is the only region where housing starts have increased every year since 2010. The other regions do not show such a steady growth pattern. In fact, they’ve actually declined in recent years. Starts in the Northeast have been falling every year since 2015, even though housing permits are up slightly. Housing starts in the Midwest have fallen since 2017, and in the West, they have fallen this year.
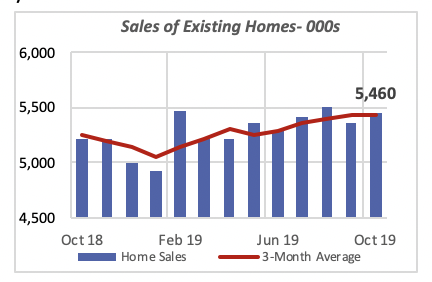
Sales of Existing Homes Rebound
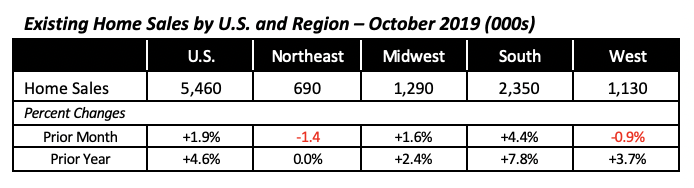
The market for existing homes bounced back modestly last month by 1.9%, to reach an annual rate of 5.46 million homes sold. Sales have been fairly stable over the last four months, following a gradual positive trend seen between February and July of this year.
Sales in October were 4.6% higher than a year ago, when they were running at an annual rate of 5.22 million units. Despite this gain, year-to-date sales through October are running behind the same period last year by 1.2%. In actual numbers, 4.51 million homes have been sold so far this year.
Regionally, the sales performance was uneven, with two regions showing declining sales: the Northeast (-1.4%) and the West ( -0.9%), while the other two regions increased. The Midwest is up 1.6%, and the South rose 4.4%.
The median sale price of all single family homes sold in October was $270,000, 6.2% higher than a year ago when the median sale price was $255,000.
Home prices are highest by far in the West, at a median of $415,000. At the other extreme, the Midwest has a median home price of $212,000, about half the price of a house in the West.
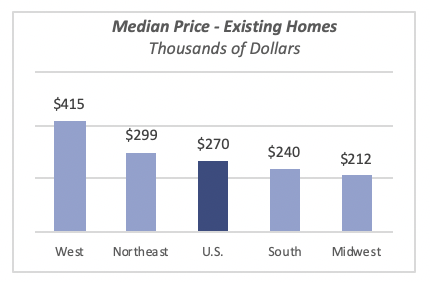
Sale prices have increased significantly in all four regions; the lowest gain compared to last year was in the South, where the median home price is 5.9% higher today. The largest increase is in the West, with median prices 7.8% ahead of last year.
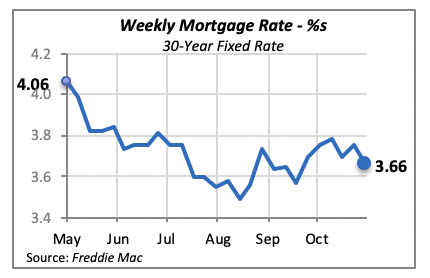
Interest Rate Slips, but No Major Effect Expected
Although mortgage rates fell last week — by nine basis points, to 3.66% — they still remain within a narrow band between 3.5% and 3.8%, where they’ve been fluctuating over the last six months. The lack of a significant change in the mortgage rate suggests that it is unlikely there will be significant housing activity in the future.
Manuel Gutierrez, Consulting Economist to NKBA
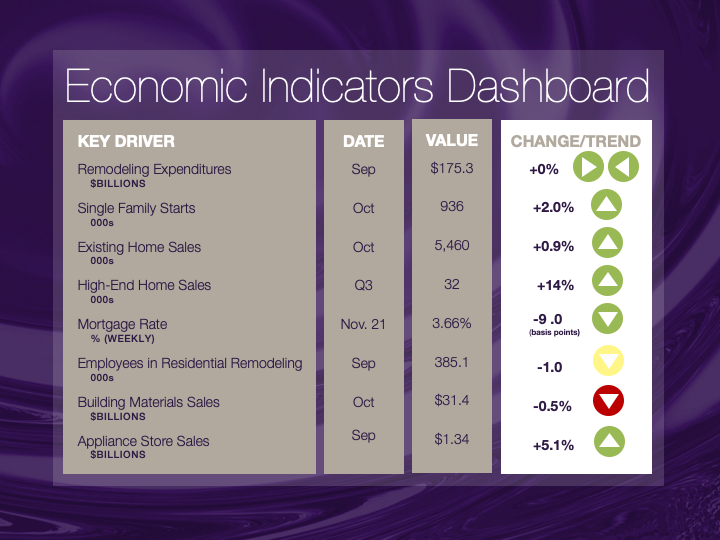
Explanation of NKBA’s Economic Indicators Dashboard
The dashboard displays the latest value of each economic indicator with a colored triangle that highlights visually the recent trend for each of the drivers. “Green” is a positive signal, indicating that the latest value is improving; “Yellow,” as it’s commonly understood, denotes caution because the variable may be changing direction; “Red” indicates that the variable in question is declining, both in its current value and in relation to the recent past.
Note that all the data, except for “mortgage rate” and “appliance-store sales” are seasonally adjusted and are represented at annual rates.
Remodeling Expenditures. This is the amount of money spent on home improvement projects during the month in question. It covers all work done for privately owned homes (excludes rentals, etc.). The data are in billions of dollars and are issued monthly by the U.S. Department of Commerce.
Single-Family Starts. This is the number of single-family houses for which construction was started in the given month. The data are in thousands of houses and are issued monthly by the U.S. Department of Commerce.
Existing-Home Sales. These data are issued monthly by the National Association of Realtors and capture the number of existing homes that were sold in the previous month.
High-End Home Sales. This series are sales of new homes priced at $500,000 and higher. The data are released quarterly by the U.S. Department of Commerce and are not seasonally adjusted. Thus, a valid comparison is made to the same quarter of prior year.
Mortgage Rate. We have chosen the rate on 30-year conventional loans that is issued by the Federal Home Loan Mortgage Corporation (known popularly as Freddie Mac.) Although there are a large number of mortgage instruments available to consumers, this one is still the most commonly used.
Employees in Residential Remodeling. This indicator denotes the number of individuals employed in construction firms that do mostly residential remodeling work.
Building-Materials Sales. These data, released monthly by the Department of Commerce, capture total sales of building materials, regardless of whether consumers or contractors purchased them. However, we should caution that the data also includes sales to projects other than residential houses.
Appliance-Store Sales. This driver captures the monthly sales of stores that sell mostly household appliances; the data are stated at an annual rate. We should not confuse this driver with total appliance sales, since they are sold by other types of stores such as home centers.
We hope you find this dashboard useful as a general guide to the state of our industry. Please contact us at Feedback@nkba.org if you would like to see further detail.


