

No Major Improvement on Foreign Trade
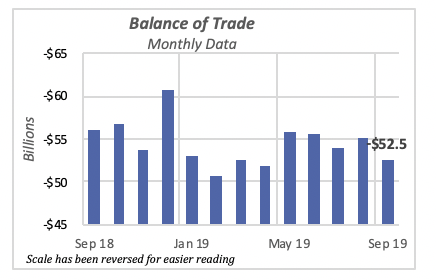
Although the balance of trade improved by nearly 5% in September to a seasonally adjusted negative balance of $52.5 billion for the month, it still remains at levels significantly higher than what it was at the turn of the century, prior to the 2007-09 economic recession.
The balance of trade hit a historical high in 2006, when it exceeded $761 billion for the full year; or a monthly average of approximately $63 billion. So, relative to that average, September’s balance is an improvement. Further, even though the balance has remained within a range of $50 billion to $55 billion since the beginning of the year, there has been a modest improvement over the last five months.
The negative balance of trade means that the U.S. continues to be indebted to foreigners, whether governments or individuals. The U.S. is importing more than it is exporting, and makes up the difference by payments in dollars or IOUs, which foreigners either hold or use to purchase assets in the U.S. As a result of its continued negative trade balances since the mid-1980s, the U.S. has become a net debtor in the sense that foreigners own more U.S. assets than Americans own foreign assets.
Favorable Services Balance, but Unfavorable Goods Balance
Foreign trade transactions are usually broken into two components: goods and services. The goods balance reflects exports and imports of physical goods that must be transported across borders. The services balance, on the other hand, does not imply movement of physical items, but rather the providing of professional and other services to foreigners, whether they are provided within the borders of the U.S. or actually in the foreign country.
Historically, the U.S. has had a favorable services balance. We export more services to foreign countries than import from them. Conversely, the balance in goods is highly negative, since the U.S. imports a greater value of physical goods than it exports.
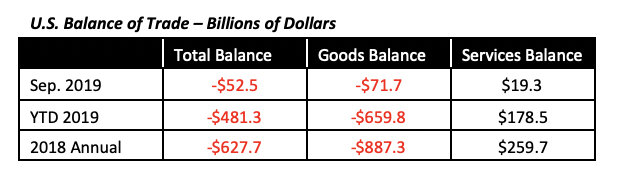
September’s $52.5 billion negative balance of trade is the result of a negative balance in goods of about $72 billion, which is nearly four times the favorable balance in services of $19.3 billion. But year-to-date through September, the balance of trade has worsened by 5% compared to last year. This is because U.S. exports are down $7 billion so far in 2019, while imports have increased by nearly $18 billion.
Fed Drops Interest Rates
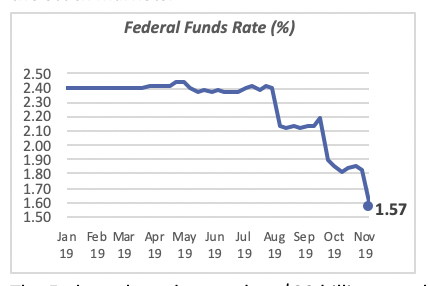
The decision by the Federal Reserve Bank to drop its basic interest rate, the so-called Federal Funds rate, to a range within 1.5% and 1.76%, took effect immediately. The Fed purchased Treasury bills and other securities with the immediate impact of raising the price of those securities, and by definition, lowering the yield, or effective interest rate.
Thus the Federal Funds rate fell from an average of 1.83% the week of Oct. 30 to the 1.57% average last week. The expectation is that the lower rate will induce businesses and consumers to borrow funds, and thus spend more. Of course, that impact is not immediate or, in fact, assured. There is wide disagreement among economists on how and whether those changes in the Federal Funds rate has the desired result in the economy. So far, its impact has bolstered the stock markets.
The Fed purchased more than $33 billion worth of securities and other agreements with banks last week, compared to the $102 billion sold over the previous 12 months. Of course, a purchase or sale mighty not necessarily result in a change in the Fed Funds rate; the bank may affect the purchase to make sure the rate remains within the bounds prescribed by the policy. Now that the rate is at 1.57% — within the 1.5% to 1.75% range — it will purchase or sell securities to make sure the rate remains in that range.
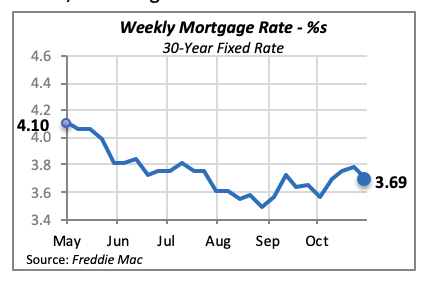
At the same time, mortgage rates also fell last week. This is not necessarily a consequence of the decline the Federal Funds rate, since mortgage rates are the result of demand and supply conditions in the mortgage markets. Mortgage rate activity primarily reflects the needs of consumers and others for funds for construction or remodeling projects, as well as the willingness by financial institutions to lend funds.
Nevertheless, the 30-year, fixed mortgage rate fell by nine basis points (0.09%) to an average of 3.69%, following four consecutive weeks of increases.
Manuel Gutierrez, Consulting Economist to NKBA
Explanation of NKBA’s Economic Indicators Dashboard
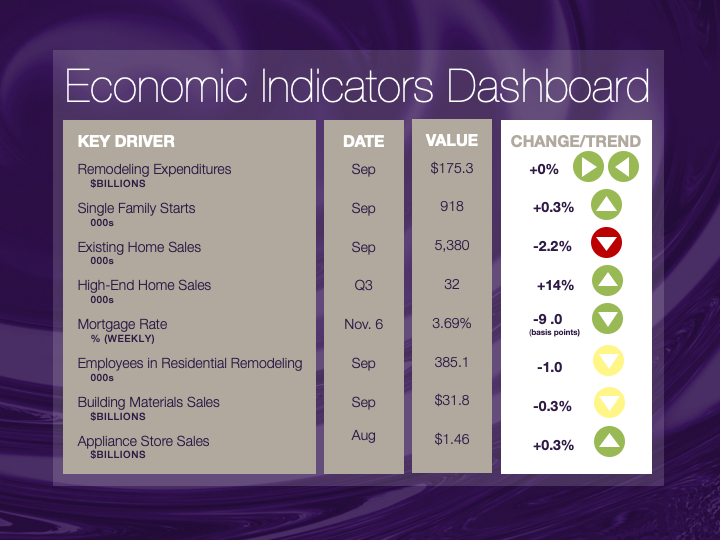
The dashboard displays the latest value of each economic indicator with a colored triangle that highlights visually the recent trend for each of the drivers. “Green” is a positive signal, indicating that the latest value is improving; “Yellow,” as it’s commonly understood, denotes caution because the variable may be changing direction; “Red” indicates that the variable in question is declining, both in its current value and in relation to the recent past.
Note that all the data, except for “mortgage rate” and “appliance-store sales” are seasonally adjusted and are represented at annual rates.
Remodeling Expenditures. This is the amount of money spent on home improvement projects during the month in question. It covers all work done for privately owned homes (excludes rentals, etc.). The data are in billions of dollars and are issued monthly by the U.S. Department of Commerce.
Single-Family Starts. This is the number of single-family houses for which construction was started in the given month. The data are in thousands of houses and are issued monthly by the U.S. Department of Commerce.
Existing-Home Sales. These data are issued monthly by the National Association of Realtors and capture the number of existing homes that were sold in the previous month.
High-End Home Sales. This series are sales of new homes priced at $500,000 and higher. The data are released quarterly by the U.S. Department of Commerce and are not seasonally adjusted. Thus, a valid comparison is made to the same quarter of prior year.
Mortgage Rate. We have chosen the rate on 30-year conventional loans that is issued by the Federal Home Loan Mortgage Corporation (known popularly as Freddie Mac.) Although there are a large number of mortgage instruments available to consumers, this one is still the most commonly used.
Employees in Residential Remodeling. This indicator denotes the number of individuals employed in construction firms that do mostly residential remodeling work.
Building-Materials Sales. These data, released monthly by the Department of Commerce, capture total sales of building materials, regardless of whether consumers or contractors purchased them. However, we should caution that the data also includes sales to projects other than residential houses.
Appliance-Store Sales. This driver captures the monthly sales of stores that sell mostly household appliances; the data are stated at an annual rate. We should not confuse this driver with total appliance sales, since they are sold by other types of stores such as home centers.
We hope you find this dashboard useful as a general guide to the state of our industry. Please contact us at Feedback@nkba.org if you would like to see further detail.


