

More Confusing Signals from Housing Market
As is often the case, the latest housing data does not offer a clear signal on the direction of the construction markets. September’s data shows housing starts falling while sales of new homes are rising. Examining the overall picture since the beginning of the year, however, both indicators show a more or less positive trend, with year-to-date housing starts flat compared to last year, while year-to-date sales of new homes are clearly higher.
Housing Starts not going anywhere soon.
New residential construction continues to falter, even though there appears to have improved mildly over the last six months. In fact, despite September’s 9% drop to an annual rate of 1.25 million units, total housing starts for the April-through-September period ran at a monthly average of 1.249 million units (annualized), 10% higher than the annualized rate 1.21 million units from October 2018 through March 2019.
This is evidenced by the three-month moving average line in the chart below, which shows a rising trend the last few months.
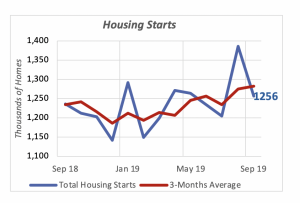
However, this trend could be deceiving. Year- to-date housing starts through September are 1% below the same period last year. It seems that with three-quarters of the year already in the books, housing construction in 2019 could very likely end up roughly the same as last year’s 1.25 million units.
The lack of life in new residential construction is a puzzle, given the growth in both employment and household incomes. There are obviously other factors impeding further growth in new home construction, since economic events are hardly ever driven by a single cause. But a main factor is likely the inability of many younger households to accumulate sufficient funds to use for a down payment on a new home, due to their crushing volume of student debt.
The national year-to-date construction stagnation is the result of declining activity in three of the four regions, particularly the West, which is down 12% since January, and the Midwest, down 6%. The Northeast is virtually flat compared to last year. But the dreary performance in these three regions is offset by the South, which is 6% above last year.
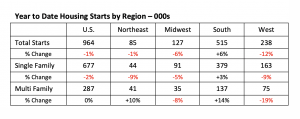
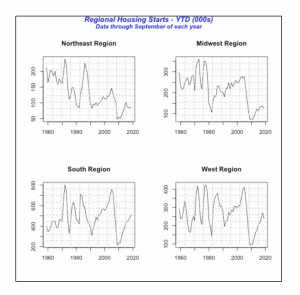
Thus, the South region is lifting the national total this year, as it has been doing over the last few years. The chart below, displaying year-to-date housing starts for the four regions back to 1980, clearly shows that both the South and the West regions have increased year after year since 2010, except that the West reversed direction last year. Housing starts in the other two regions, Northeast and Midwest, stalled around 2015 or earlier.
Rebound in New Home Sales
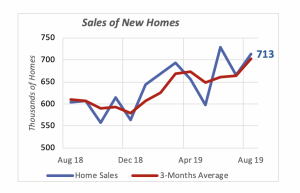
Sales of new homes bounced back in September, rising 7% to reach an annualized rate of 713,000 units, very close to the 729,000-unit rate hit two months earlier in July. There has not been such a high sales rate since late 2007, at the dawn of the 2007-2009 Great Recession.
Also, similar to new residential construction, sales of new homes have been improving gradually over the last few months. The annualized sales rate moved up from 600,000 in the second half of last year, to a monthly average of 671,000 so far this year; the pace of the last three months is higher still, at 702,000 units (annualized average per month).
This is quite apparent in the chart below, which indicates that the three-month moving average has a clear upward trend.
Moreover, so far this year 473,000 new homes have been sold. This is 27,000 homes more than the same period last year.
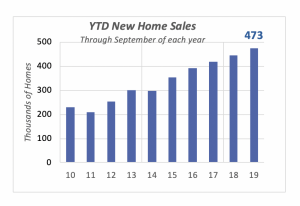
Year-to-date, home sales have been increasing every year since 2014, when only 298,000 homes had been sold through September of that year.
Retail Sales Slip
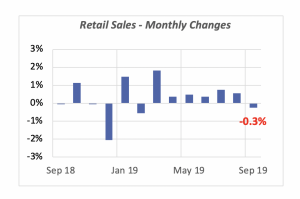
Total retail sales fell last month by 0.3%, to a seasonally adjusted $526 billion, which created disruptions in the stock markets, given expectations that sales would increase in September.
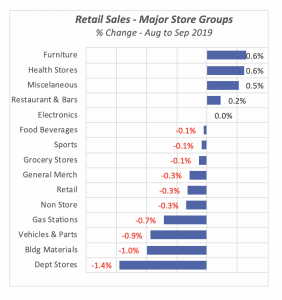
Sales fell in most product categories, including declines in the biggest categories. For instance, sales of vehicles and parts, which accounts for one-fifth of sales, fell by 0.9% in the month. Other important areas, such as food & beverageplaces (i.e., restaurants and bars) and grocery stores, which jointly account for another 20% of retail sales, each dropped by a marginal 0.1%.
Closer to home, sales at building materials stores also fell in September by 1%, one of the largest drops except for sales at department stores, which dropped 1.4% and have been falling for quite some time.
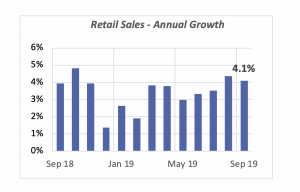
But compared to last year, retail sales are recording robust growth. In fact, as illustrated in the chart below, retail sales in September were 4.1% above September of last year, and they are the second highest growth rate this year. The last month with a higher growth rate was October 2018.
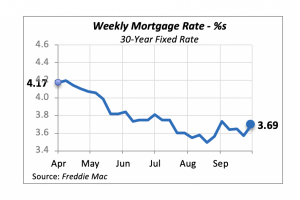
Mortgage Rates Climb
Interest rates reversed direction last week, rising by 0.12% to 3.69%.
There is no way to tell the future direction of mortgage rates, even though there is pressure and some indications that the Federal Reserve Bank might continue to push interest rates down.
However, the experience of the past few years, when the Fed maintained interest rates at nearly zero, should serve as a warning that relief will not come from this source.
Manuel Gutierrez, Consulting Economist to NKBA
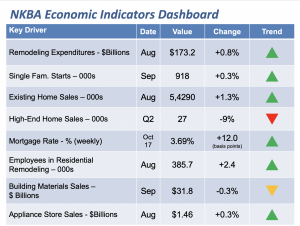
Explanation of NKBA’s Economic Indicators Dashboard
The dashboard displays the latest value of each economic indicator with a colored triangle that highlights visually the recent trend for each of the drivers. “Green” is a positive signal, indicating that the latest value is improving; “Yellow,” as it’s commonly understood, denotes caution because the variable may be changing direction; “Red” indicates that the variable in question is declining, both in its current value and in relation to the recent past.
Note that all the data, except for “mortgage rate” and “appliance-store sales” are seasonally adjusted and are represented at annual rates.
Remodeling Expenditures. This is the amount of money spent on home improvement projects during the month in question. It covers all work done for privately owned homes (excludes rentals, etc.). The data are in billions of dollars and are issued monthly by the U.S. Department of Commerce.
Single-Family Starts. This is the number of single-family houses for which construction was started in the given month. The data are in thousands of houses and are issued monthly by the U.S. Department of Commerce.
Existing-Home Sales. These data are issued monthly by the National Association of Realtors and capture the number of existing homes that were sold in the previous month.
High-End Home Sales. This series are sales of new homes priced at $500,000 and higher. The data are released quarterly by the U.S. Department of Commerce and are not seasonally adjusted. Thus, a valid comparison is made to the same quarter of prior year.
Mortgage Rate. We have chosen the rate on 30-year conventional loans that is issued by the Federal Home Loan Mortgage Corporation (known popularly as Freddie Mac.) Although there are a large number of mortgage instruments available to consumers, this one is still the most commonly used.
Employees in Residential Remodeling. This indicator denotes the number of individuals employed in construction firms that do mostly residential remodeling work.
Building-Materials Sales. These data, released monthly by the Department of Commerce, capture total sales of building materials, regardless of whether consumers or contractors purchased them. However, we should caution that the data also includes sales to projects other than residential houses.
Appliance-Store Sales. This driver captures the monthly sales of stores that sell mostly household appliances; the data are stated at an annual rate. We should not confuse this driver with total appliance sales, since they are sold by other types of stores such as home centers.
We hope you find this dashboard useful as a general guide to the state of our industry. Please contact us at Feedback@nkba.org if you would like to see further detail.


