

Foreign Trade Improvements in Sight?
Last week, there were signs of improvement in trade talks with China, with the apparent agreement by China that it will purchase from the U.S. more agricultural products than it had in the past, prior to the imposition of tariffs by the Trump administration. This may bring some relief, but there is still a lot of work ahead to re-establish “normal” trade relations with China.
So far, U.S. tariffs on imported goods from China and the expected Chinese retaliation have resulted in losses for both sides — which is what was expected. The U.S. has suffered a decline of 0.9% in global exports, stemming from falling exports to China, which have dropped by $13.4 billion year-to-date through August, compared to the same period last year. However, Hong Kong, Mexico and Canada also contributed to the overall drop in U.S. exports.
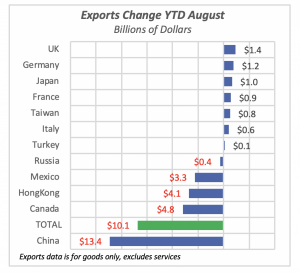
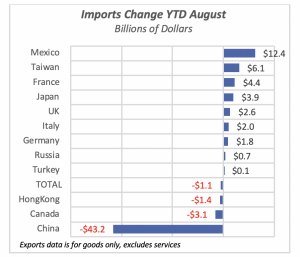
But the imports side brings a different picture. The same three countries still lead in declines in imports (China, Canada and Hong Kong). But China’s magnitude is much larger, with a $43.2 billion decline in U.S. imports from that country, compared to the aforementioned $13.4 billion drop in exports. In other words, Chinese manufacturers are getting a hit three-and-a-half times harder than U.S. producers.
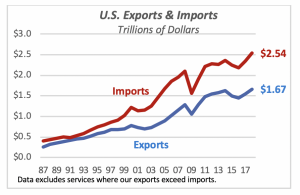
Taking a longer look than just the last two years, U.S. exports and imports of goods have grown dramatically over the last three decades. In 1987, U.S. exports were $254 billion and jumped to $1.67 trillion last year — an increase of 556% over this period. Exports rose from 5.2% of GDP in 1987 to last year’s 8.1%.
But historically, U.S. imports have increased dramatically, too. Total U.S. imports of goods (note, the data excludes services) amounted to $406 billion in 1987, for a 525% increase between 1987 and 2018, when they reached $2.54 trillion.
As a ratio to Gross Domestic Product, imports were 8.4% of total GDP in 1987 but rose to 12.3% last year.
Nearly six of every 10 dollars of imported goods originate in five countries. China, as is well known, accounts for over 20% of our imports; last year the U.S. imported just under $540 billion worth of goods from China. But this year has seen a reversal, with imports from China, through August, falling 12.5% from 2018.
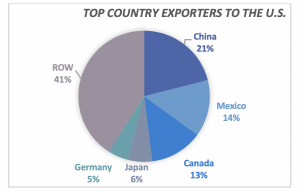
In contrast to China, U.S. imports from Mexico are running 5.5% ahead of last year. Mexico is the second largest supplier of foreign goods to the U.S. The top five exporting countries account for 59% of all goods coming into the U.S.; the rest of the world (ROW) sends 41%.
Year-to-date trade through August, as cited above, paints a slightly different picture. The growth in both U.S. imports and exports seen between 2015 and 2017 vanishes, and turns into a modest decline. Imports are virtually the same as last year, down to $1.67 trillion, which is just 0.1% lower so far in 2019. But exports have fallen nearly 1% to $1.1 trillion.
Consumer Sentiment Recovers
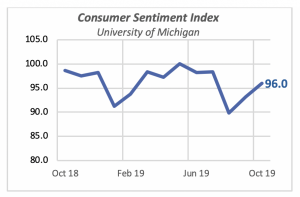
Along with the improvement in trade talks, last week brought news that consumer confidence in the U.S. economy improved this month.
The University of Michigan’s Consumer Sentiment Index, which surveys consumers on a monthly basis to get their assessment of the current economy as well as its future prospects, rose unexpectedly in October to 96.0. This is the second monthly increase, which suggests that consumers have become more optimistic about the U.S. economy.
Inflation Holds Steady
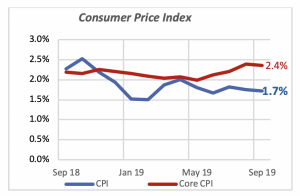
Last week’s release of price data for September revealed that the Consumer Price Index (CPI) remained unchanged from the previous month. The overall index rose at 1.7% from September 2018, and the “core CPI” was up higher, 2.4% compared to last year.
The “core CPI” is purported to capture the overall trend in prices, by removing two volatile items in the index: food and energy products. These products, incidentally, are the ones that hit consumer products the hardest.
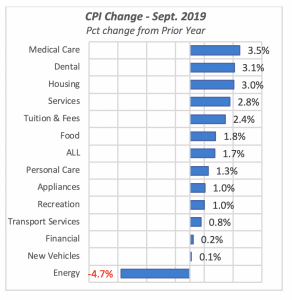
The chart below displays the change in consumer prices for select general categories. Leading is Medical Care rising by 3.5% from last year. But contrary to what one would expect, this increase is due to a fast rise in Medical Services, up 4.4%, while Medical Products, like drugs, rose minimally by just 0.3%.
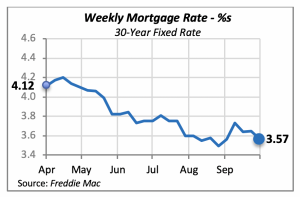
Mortgage Rates Continue Their Slide
Mortgage rates fell again last week; this time by eight basis points to 3.57% for the 30-year fixed rate. While the Fed is under heavy political pressure to take a more accommodating position, i.e., push interest rates down, their impact on the housing markets has been minimal.
There are other factors impeding an improvement in the housing markets. The most prominent is house prices, that are back exceeding the levels last seen prior to the 2008-09 recession, which created havoc among homeowners.
But the situation then was a lot different from today’s. At that time, there were millions of people who had become homeowners by borrowing funds with little or no down payments, and low credit scores. The low credit scores were an indication that most of these potential homeowners were a high credit risk, which proved to be the case and led to millions of bankruptcies and households losing their homes.
Manuel Gutierrez, Consulting Economist to NKBA
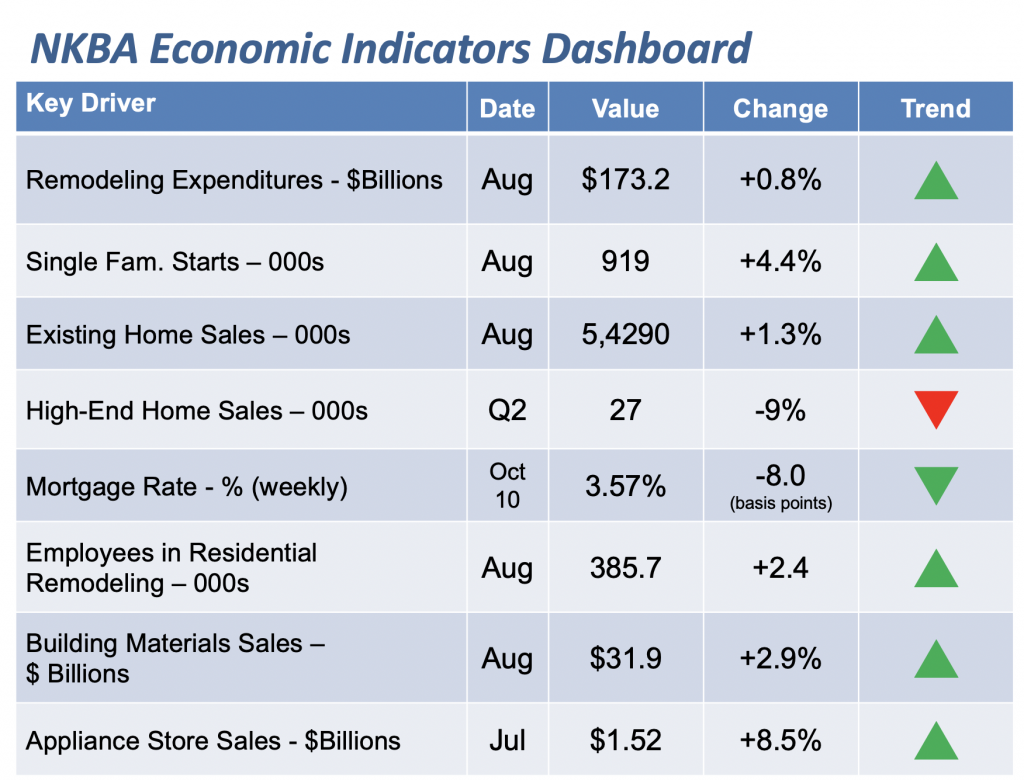
Explanation of NKBA’s Economic Indicators Dashboard
The dashboard displays the latest value of each economic indicator with a colored triangle that highlights visually the recent trend for each of the drivers. “Green” is a positive signal, indicating that the latest value is improving; “Yellow,” as it’s commonly understood, denotes caution because the variable may be changing direction; “Red” indicates that the variable in question is declining, both in its current value and in relation to the recent past.
Note that all the data, except for “mortgage rate” and “appliance-store sales” are seasonally adjusted and are represented at annual rates.
Remodeling Expenditures. This is the amount of money spent on home improvement projects during the month in question. It covers all work done for privately owned homes (excludes rentals, etc.). The data are in billions of dollars and are issued monthly by the U.S. Department of Commerce.
Single-Family Starts. This is the number of single-family houses for which construction was started in the given month. The data are in thousands of houses and are issued monthly by the U.S. Department of Commerce.
Existing-Home Sales. These data are issued monthly by the National Association of Realtors and capture the number of existing homes that were sold in the previous month.
High-End Home Sales. This series are sales of new homes priced at $500,000 and higher. The data are released quarterly by the U.S. Department of Commerce and are not seasonally adjusted. Thus, a valid comparison is made to the same quarter of prior year.
Mortgage Rate. We have chosen the rate on 30-year conventional loans that is issued by the Federal Home Loan Mortgage Corporation (known popularly as Freddie Mac.) Although there are a large number of mortgage instruments available to consumers, this one is still the most commonly used.
Employees in Residential Remodeling. This indicator denotes the number of individuals employed in construction firms that do mostly residential remodeling work.
Building-Materials Sales. These data, released monthly by the Department of Commerce, capture total sales of building materials, regardless of whether consumers or contractors purchased them. However, we should caution that the data also includes sales to projects other than residential houses.
Appliance-Store Sales. This driver captures the monthly sales of stores that sell mostly household appliances; the data are stated at an annual rate. We should not confuse this driver with total appliance sales, since they are sold by other types of stores such as home centers.
We hope you find this dashboard useful as a general guide to the state of our industry. Please contact us at Feedback@nkba.org if you would like to see further detail.


