

Job Growth Slows in August
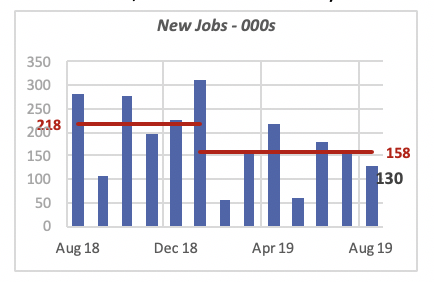
Total employment in the U.S. grew by 130,000 jobs in August. While still respectable, this is lower than the preceding two months, and lower than the monthly average of 187,000 jobs in the previous 12 months.
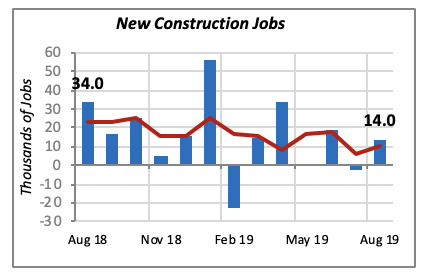
Through August, a total of 1.27 million jobs have been created; this is 600,000 fewer jobs than the 1.87 million jobs created over the same period last year. The pace of job growth has clearly slowed down, which is illustrated by the red lines in the chart below.
Further, a large portion of last month’s job growth originated from the government hiring additional workers. The private sector contributed 74% of the new jobs, or 96,000, and the government added the remainder 26%, or 34,000 jobs. Such a large contribution by government is highly unusual; typically, government generates approximately 17% of new jobs. One explanation is that the Federal government started hiring workers for next year’s decennial census; it is estimated that early next year, the Federal government will have added approximately 750,000 workers to its rolls, although the jobs are only temporary until the census is completed.
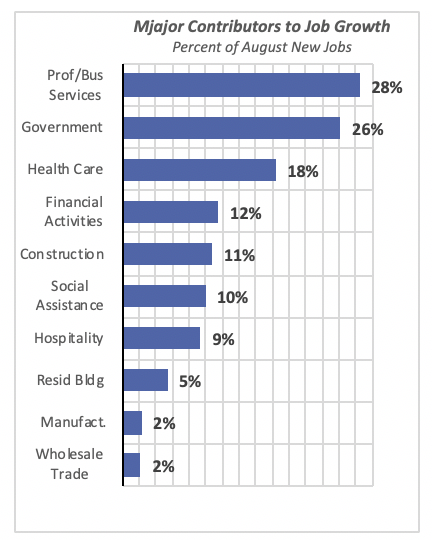
But the biggest contributor to job growth last month by segment was Professional & Business Services, which added 37,000 jobs, or over a quarter of the total new jobs. Governmentcomes in second with the 34,000 new positions cited above.
Closer to K&B businesses, as the chart below illustrates, the Constructionsector added 14,000 new jobs in August, or 11% of the total.
Manufacturing, which lost 7.2 million jobs from its peak in the late 1970s, has regained 1.4 million jobs since its low point in 2010. Last month, slightly over 3,000 manufacturing jobs were added — only 2% of the August total.
Several sectors saw employment fall last month. Largest losses were in Retail, which lost 11,100 jobs in the month. The retail sector accounts for 10% of overall U.S. employment. Mininglost 5,600 jobs, and Educational Servicescontracted by 5,400 jobs.
The table below displays other key employment statistics that, generally, still provide a favorable view of the state of the economy today.
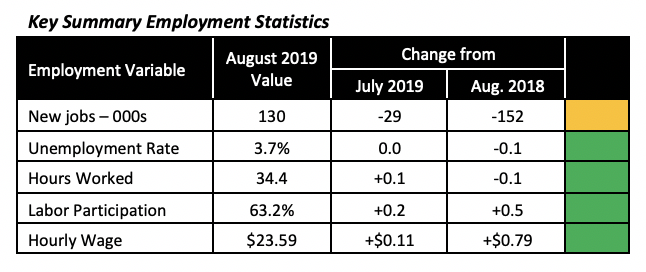
Most employment data are a good indicator of the current health of the economy, but they are generally not a reliable indicator of its direction a few months hence. This is simply because even if the economy slows down, with manufacturing shipments or retail sales falling, employers will retain workers and are reluctant to cut employment until they are sure that the economy is indeed in a recession. It is very costly for employers to find, hire and train new workers.
Construction Employment Slides Slightly
There are currently over 7.5 million persons employed in the construction industry, accounting for 5% of total U.S. employment.
The number of construction jobs fluctuates from month to month but, on average, as shown in the chart below, the number of new jobs has been declining modestly. This is in line with new residential construction which, through July of this year, have generated 3% fewer housing starts than last year.
The bulk of the jobs in construction are in the Specialty Trades, which accounted for nearly two-thirds of all construction, or 4.8 million jobs, in August.
Workers directly involved in building, both residential and non-residential, account for 22% of total construction-related jobs. And 1.1 million workers are involved in infrastructure projects, such as roads and bridges, for 14% of the total.
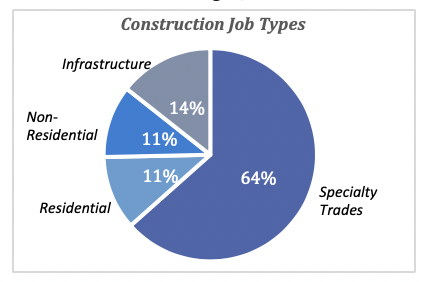
But while the trades represent 64% of total construction jobs, they contributed only 5% to the new jobs added in construction. The largest contributor was Construction of Buildings, both residential and non-residential, which generated 8,800 new jobs, or 63% of total new construction jobs.
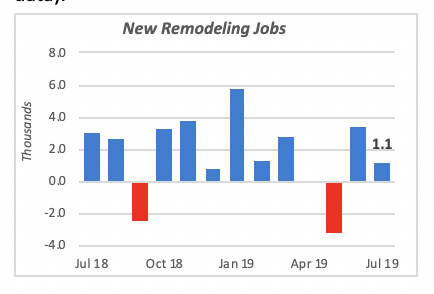
Residential remodeling, which accounts for 5% of all construction jobs, generated an additional 1,100 jobs in July (remodeling jobs data is delayed by one month from most other construction data).
Construction Spending Dips
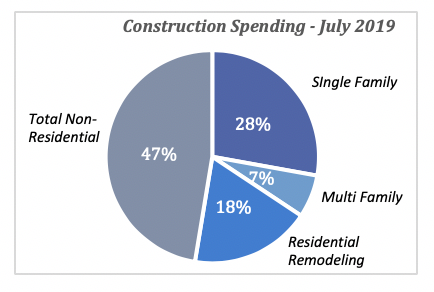
At the same time, total spending on private construction fell 0.8% in July, to an estimated annual rate of $963 billion. The contributions of both residential and non-residential construction were nearly equal, with residential taking 53% of total construction, or $507 billion.
Total construction spending has been falling, more or less steadily, since early 2018, when it was running at an annual rate of $1 trillion. Since then, the pace of monthly construction has declined by roughly $71 billion — a $64 billion drop in residential construction, and a $7.5 billion fall in non-residential construction.
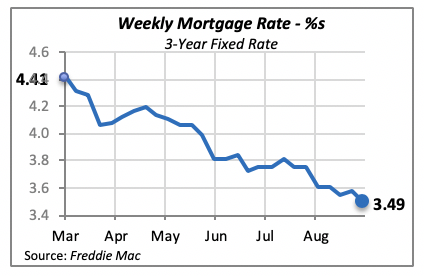
Mortgage Rates Continue To Fall
The 30-year, fixed mortgage rate fell by nine basis points last week, to 3.49%. This rate has fallen nearly 1% since the beginning of March, when it was at 4.41%.
Manuel Gutierrez, Consulting Economist to NKBA
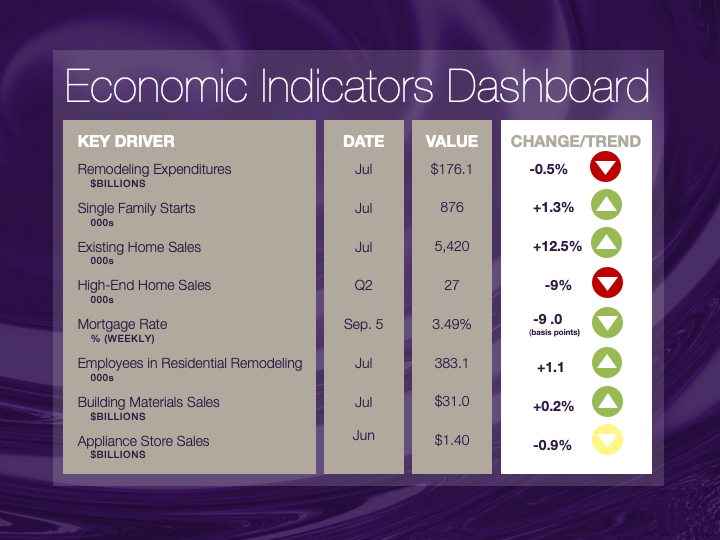
Explanation of NKBA’s Economic Indicators Dashboard
The dashboard displays the latest value of each economic indicator with a colored triangle that highlights visually the recent trend for each of the drivers. “Green” is a positive signal, indicating that the latest value is improving; “Yellow,” as it’s commonly understood, denotes caution because the variable may be changing direction; “Red” indicates that the variable in question is declining, both in its current value and in relation to the recent past.
Note that all the data, except for “mortgage rate” and “appliance-store sales” are seasonally adjusted and are represented at annual rates.
Remodeling Expenditures. This is the amount of money spent on home improvement projects during the month in question. It covers all work done for privately owned homes (excludes rentals, etc.). The data are in billions of dollars and are issued monthly by the U.S. Department of Commerce.
Single-Family Starts. This is the number of single-family houses for which construction was started in the given month. The data are in thousands of houses and are issued monthly by the U.S. Department of Commerce.
Existing-Home Sales. These data are issued monthly by the National Association of Realtors and capture the number of existing homes that were sold in the previous month.
High-End Home Sales. This series are sales of new homes priced at $500,000 and higher. The data are released quarterly by the U.S. Department of Commerce and are not seasonally adjusted. Thus, a valid comparison is made to the same quarter of prior year.
Mortgage Rate. We have chosen the rate on 30-year conventional loans that is issued by the Federal Home Loan Mortgage Corporation (known popularly as Freddie Mac.) Although there are a large number of mortgage instruments available to consumers, this one is still the most commonly used.
Employees in Residential Remodeling. This indicator denotes the number of individuals employed in construction firms that do mostly residential remodeling work.
Building-Materials Sales. These data, released monthly by the Department of Commerce, capture total sales of building materials, regardless of whether consumers or contractors purchased them. However, we should caution that the data also includes sales to projects other than residential houses.
Appliance-Store Sales.This driver captures the monthly sales of stores that sell mostly household appliances; the data are stated at an annual rate. We should not confuse this driver with total appliance sales, since they are sold by other types of stores such as home centers.
We hope you find this dashboard useful as a general guide to the state of our industry. Please contact us at Feedback@nkba.orgif you would like to see further detail.


