

Retail Sales Spike
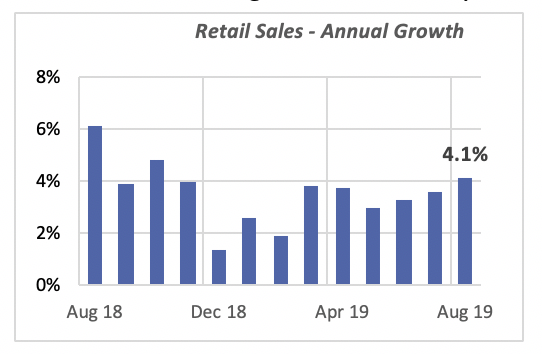
Retail sales took a surprising 4% jump in August, confounding all expectations for a decline. Spending by consumers continues to fuel the economy, despite signals of slower growth in other areas, like manufacturing.
Last month’s 4% gain is the highest since April; in fact, as the chart below shows, the pace of annual increases has been rising for the last four months. Year-to-date through August, retail sales are 3.3% above the same period last year. In dollars, total retail sales amount to $4.1 trillion for the first eight months of this year.
The boost in retail sales was driven by sales of Vehicles & Parts stores, i.e., auto dealerships and service parts stores, which jumped 7% in August. In the preceding year, they had barely increased by a 2% monthly average. Vehicles & Parts stores are the most significant component of retail sales, accounting for 20% of total sales.
But leading the retail sector are sales from Mail & Internet outlets, which increased 16% in August. This is the highest annual increase in more than 20 years. It’s also higher than the monthly average of 11%, which has held steady since August of last year.
Mail & Internet today capture one of every eight retail dollars, or 12%.
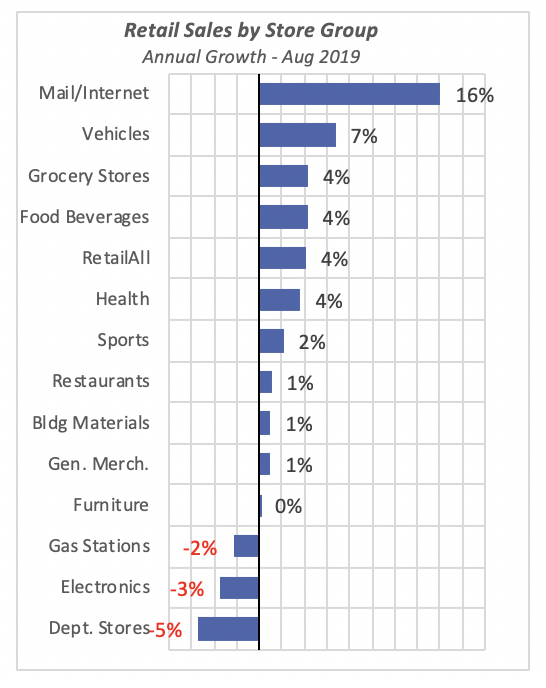
Declining sales are evident in only three categories. One is Gas Stations, with sales falling 2% in August. This is not a surprise, given that the price of crude oil is averaging $60 a barrel, down nearly 15% from its level just three months ago. However, the recent attack on the Saudi Arabia oil field, which presumably has removed about 5% of the world’s oil supply, will inevitably result in a rise in oil prices and, subsequently an increase at the pump.
The other two categories with declining retail sales — Electronics/Appliance Stores and Department Stores — continue to suffer as the consequence of internet sales.
Building Materials Sales Edge Higher
After three months of consecutive declines, sales at Building Materials stores rose 1% in August to reach $31.9 billion.
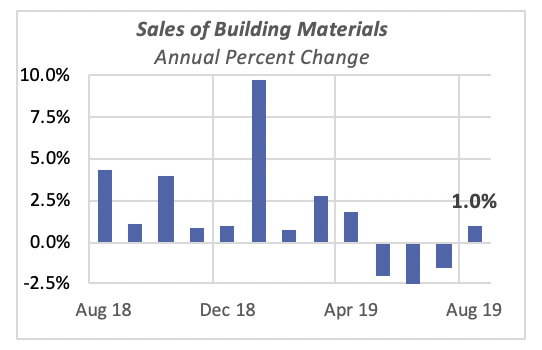
Except for the extremely unusual jump in sales in January, when they increased by 9.7%, sales have been less than 2.5% above last year so far through August.
But given the state of the construction industry in general, sales at building-materials stores are performing relatively well. The value of total private construction has been running below prior-year levels since November 2018.

The chart above, which compares sales of building materials and the value of private construction over the past year, shows that building materials sales (the blue line) was running ahead of prior-year levels through April. In contrast, the value of private construction (the yellow line) has been below prior-year levels since last November — although in August, both of them are back in positive territory compared to August 2018.
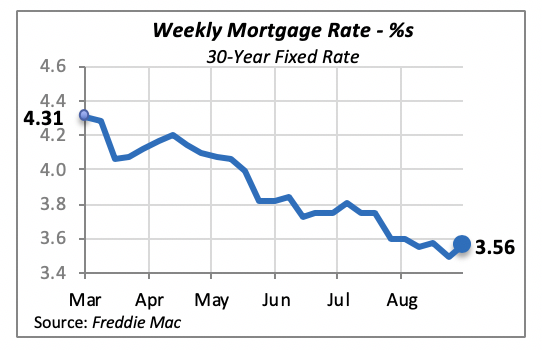
Mortgage Rates Mostly Stable Despite Slight Uptick
Last week mortgage rates rose modestly by seven basis points to 3.56%; this is within the same range they’ve been in the last four weeks. It is unknown of course, at the time of this writing, the direction that interest rates will take after the Federal Reserve’s Board meeting this week. At its last meeting, at the end of July, the Board decided to move the target interest rate down by a quarter percentage point, from a range between 2.25% and 2.5% to a range between 2% and 2.25%.
Manuel Gutierrez, Consulting Economist to NKBA
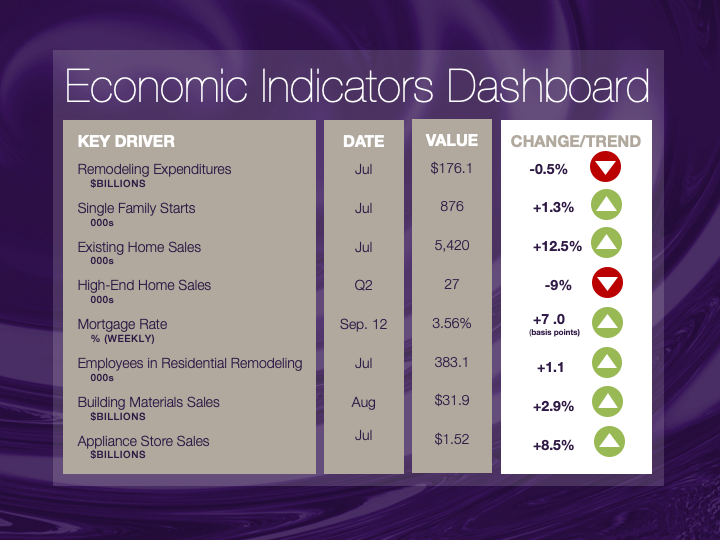
Explanation of NKBA’s Economic Indicators Dashboard
The dashboard displays the latest value of each economic indicator with a colored triangle that highlights visually the recent trend for each of the drivers. “Green” is a positive signal, indicating that the latest value is improving; “Yellow,” as it’s commonly understood, denotes caution because the variable may be changing direction; “Red” indicates that the variable in question is declining, both in its current value and in relation to the recent past.
Note that all the data, except for “mortgage rate” and “appliance-store sales” are seasonally adjusted and are represented at annual rates.
Remodeling Expenditures. This is the amount of money spent on home improvement projects during the month in question. It covers all work done for privately owned homes (excludes rentals, etc.). The data are in billions of dollars and are issued monthly by the U.S. Department of Commerce.
Single-Family Starts. This is the number of single-family houses for which construction was started in the given month. The data are in thousands of houses and are issued monthly by the U.S. Department of Commerce.
Existing-Home Sales. These data are issued monthly by the National Association of Realtors and capture the number of existing homes that were sold in the previous month.
High-End Home Sales. This series are sales of new homes priced at $500,000 and higher. The data are released quarterly by the U.S. Department of Commerce and are not seasonally adjusted. Thus, a valid comparison is made to the same quarter of prior year.
Mortgage Rate. We have chosen the rate on 30-year conventional loans that is issued by the Federal Home Loan Mortgage Corporation (known popularly as Freddie Mac.) Although there are a large number of mortgage instruments available to consumers, this one is still the most commonly used.
Employees in Residential Remodeling. This indicator denotes the number of individuals employed in construction firms that do mostly residential remodeling work.
Building-Materials Sales. These data, released monthly by the Department of Commerce, capture total sales of building materials, regardless of whether consumers or contractors purchased them. However, we should caution that the data also includes sales to projects other than residential houses.
Appliance-Store Sales. This driver captures the monthly sales of stores that sell mostly household appliances; the data are stated at an annual rate. We should not confuse this driver with total appliance sales, since they are sold by other types of stores such as home centers.
We hope you find this dashboard useful as a general guide to the state of our industry. Please contact us at Feedback@nkba.org if you would like to see further detail.


