

Remodeling Market Stumbles
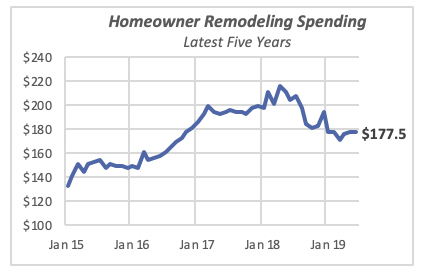
Homeowner expenditures for remodeling fell in June by 0.5% to just under an annualized rate of $178 billion. This loss virtually erases the gains of the previous month, when expenditures increased by 0.7%.
Remodeling expenditures rose sharply between 2016 and the beginning of 2018, increasing by a phenomenal 44% from $150 billion at the beginning of 2016, to its recent peak of $216 billion in April 2018. Since then, expenditures have been declining.
Remodeling expenditures for most of this year have hovered around $177 billion, however, perhaps signaling that the market is stable.
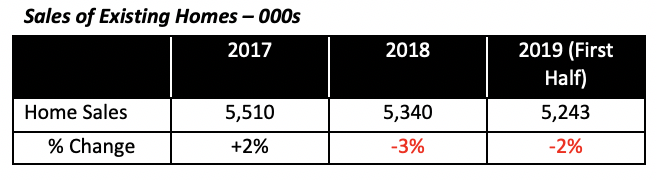
A significant driver of home remodeling is the sale of existing homes. Such sales declined last year and are likely to fall further for the full year in 2019. This lower rate of home sales portend less remodeling activity originating from this source over the next couple of years.
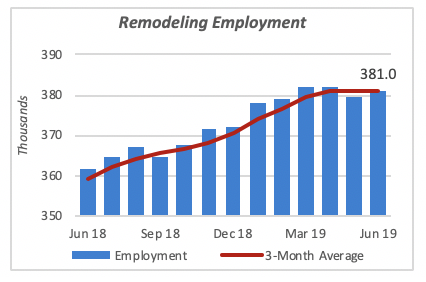
On the employment side of the remodeling markets, remodeling firms hired an additional 1,400 workers in June, partly reversing the loss of 2,200 workers in the previous month. For all practical purposes, employment growth among remodeling firms has stopped and total employment has stabilized for now at around 381,000 workers.
Note that remodeling firms are involved in both residential and non-residential work, while the spending data cited above reflects homeowners’ activity only. Any remodeling done to apartment buildings is excluded from the spending data.
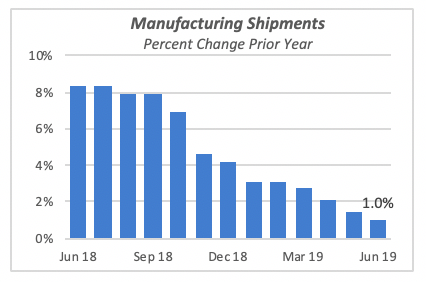
Manufacturing Shipments Stall
The manufacturing sector continues to wind down, no doubt hindered by the uncertain trade situation. Even though total shipments in June were up 0.4% to $506 billion, they were only 1% higher than their year-ago levels. In fact, as shown in the chart below, the rate of growth compared to the prior year has been declining steadily.
In June of last year, shipments were growing at a rate of 8% from 2017 levels; this is much higher than the current year’s 1% growth.
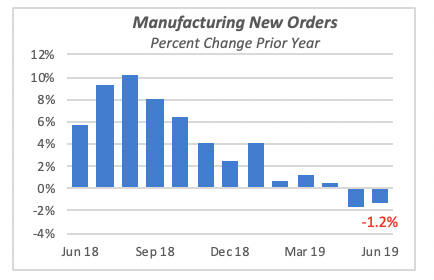
New manufacturing orders rose 0.6% in June to $494 billion. However, this increase follows declines in the previous two months.
Compared to last year, new manufacturing orders are 1.2% lower. Similar to shipments, the annual growth of new orders has been declining since the middle of last year. The decline in orders clearly indicates further erosion in shipment in the next few months.
Within the manufacturing categories,Computers & Electronic Equipmentmanufacturing is 4.6% ahead of last year, although it fell 0.7% in June. Transportation Equipmentjumped 3% for the month and is 3.7% ahead of last year. The performance is driven mostly by Light Trucks & Vehicles,which jumped 6.7% in June and is still running nearly 12% ahead of 2018.
The chart below displays the major manufacturing groups. We can see that manufacturing of Construction Materials & Supplies is ahead of both the previous month (+0.7%) and last year (+2%)

Mortgage Rates Decline Sharply
Last month’s move by the Federal Reserve to lower the Fed Funds Rate had an immediate impact on mortgage rates. The 30-year fixed mortgage rate fell by 15 basis points to 3.6%; this is the lowest it has been since early November 2016, when it was 3.54%.
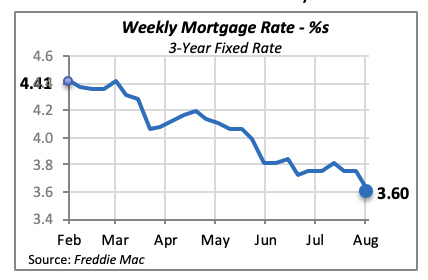
Although economists do not expect a great resurgence in home construction or remodeling from the decline in mortgage rates, the Mortgage Bankers Association reported a 5.3% increase in mortgage applications for the week ended Aug. 2. But according to the association, the bulk of the loan applications were for refinancing existing loans, while those for home purchases actually declined by 2%.
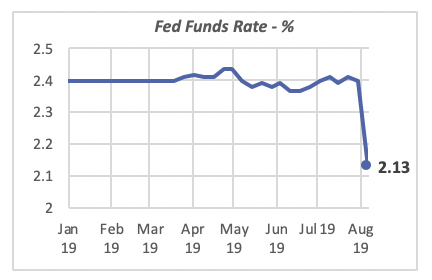
The Federal Funds Rate has fallen to within the range prescribed by the monetary policy enacted at the last meeting of the Federal Open Market Committee, which stipulated the rate should be between 2% and 2.25%.
Manuel Gutierrez, Consulting Economist to NKBA
Explanation of NKBA’s Economic Indicators Dashboard
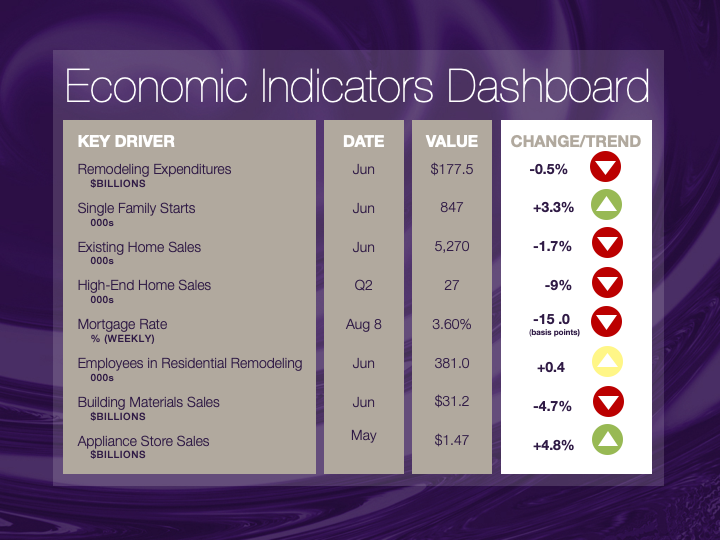
The dashboard displays the latest value of each economic indicator with a colored triangle that highlights visually the recent trend for each of the drivers. “Green” is a positive signal, indicating that the latest value is improving; “Yellow,” as it’s commonly understood, denotes caution because the variable may be changing direction; “Red” indicates that the variable in question is declining, both in its current value and in relation to the recent past.
Note that all the data, except for “mortgage rate” and “appliance-store sales” are seasonally adjusted and are represented at annual rates.
Remodeling Expenditures. This is the amount of money spent on home improvement projects during the month in question. It covers all work done for privately owned homes (excludes rentals, etc.). The data are in billions of dollars and are issued monthly by the U.S. Department of Commerce.
Single-Family Starts. This is the number of single-family houses for which construction was started in the given month. The data are in thousands of houses and are issued monthly by the U.S. Department of Commerce.
Existing-Home Sales. These data are issued monthly by the National Association of Realtors and capture the number of existing homes that were sold in the previous month.
High-End Home Sales. This series are sales of new homes priced at $500,000 and higher. The data are released quarterly by the U.S. Department of Commerce and are not seasonally adjusted. Thus, a valid comparison is made to the same quarter of prior year.
Mortgage Rate. We have chosen the rate on 30-year conventional loans that is issued by the Federal Home Loan Mortgage Corporation (known popularly as Freddie Mac.) Although there are a large number of mortgage instruments available to consumers, this one is still the most commonly used.
Employees in Residential Remodeling. This indicator denotes the number of individuals employed in construction firms that do mostly residential remodeling work.
Building-Materials Sales. These data, released monthly by the Department of Commerce, capture total sales of building materials, regardless of whether consumers or contractors purchased them. However, we should caution that the data also includes sales to projects other than residential houses.
Appliance-Store Sales.This driver captures the monthly sales of stores that sell mostly household appliances; the data are stated at an annual rate. We should not confuse this driver with total appliance sales, since they are sold by other types of stores such as home centers.
We hope you find this dashboard useful as a general guide to the state of our industry. Please contact us at Feedback@nkba.orgif you would like to see further detail.


