

How New Homes Are Changing
Once a year, the Department of Commerce conducts a survey of the new houses built in the U.S. in the prior year, identifying key characteristics of those homes as well as trends in those characteristics over time.
One drawback is that the data released so far allows only for analysis of each characteristic individually; this data does not reveal correlations among characteristics. For instance, the data can state the number of stories per house, and how they have changed over time, but it doesn’t explain how the number of stories is correlated to the size of the house.
A full data set that would allow a deeper analysis will be released at some point, however, the government shutdown in late December/early January has caused such delay. Thus, here and perhaps over the next couple of weeks, is the relevant analysis that’s possible with the data available.
Size of New Homes Is Shrinking
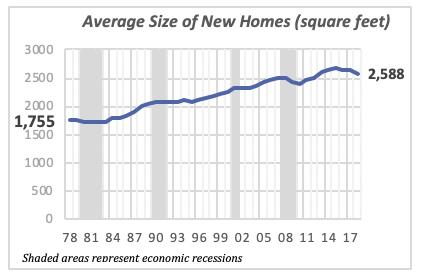
Historically, new homes have been getting larger every year, with the only exception is that during recession periods, home size typically has shrunk. Homes increased in size from 1,755 square feet in 1978, the year when the government began collecting this data, to last year’s 2,588 square feet — an increase of 833 square feet over the 40-year period.
As seen in the chart below, house size fell in each of the last four recessions (the gray-shaded bars in the chart). However, it’s also clear that home size has fallen the last three years, despite this not being a recession period. In fact, house size fell from the peak of 2,687 square feet reached in 2015 to the average of 2,588 square feet last year, a reduction of 99 square feet in just three years.
While the historical increase in home size was the result of increases in the percentage of homes larger than 2,400 square feet (see the upward movement in red and blue lines in the chart below), the drop in size since 2015 was caused by a drop in homes that are 3,000 square feet or larger (the red line is the only one falling since 2015).
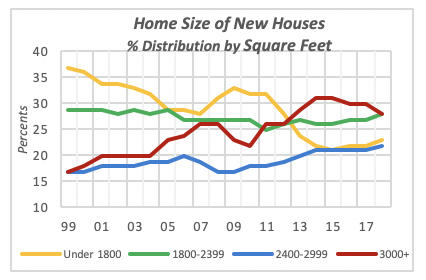
Two things stand out in the chart above. One is the steady decline in the percentage of small homes, i.e. those under 1,800 square feet. They represented 37% of homes built in 1978 to last year’s 23%.
The other is the increase in the percentage of largest homes, those that are at least 3,000 square feet. They accounted for one in six (17%) homes built in 1978 to last year’s slightly improved 28%.
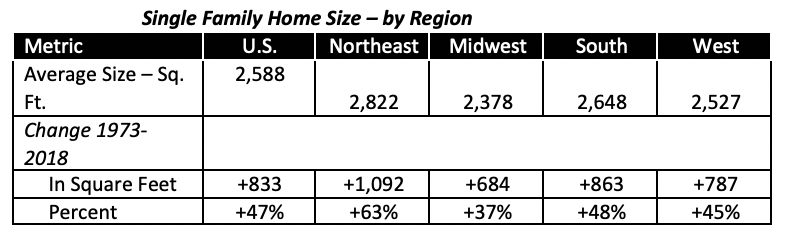
Interestingly, the biggest homes are built in the Northeast region while the Midwest has the smallest houses. The typical new house in the Northeast is on average 9% larger than the national total, or 234 square feet bigger. In contrast, new single-family houses in the Midwest are 210 square feet smaller. Houses in the other two regions more closely resemble the national sizes; in the South they are 2% larger and, conversely, in the West they are 2% smaller.
Number of Bathrooms Rises
One characteristic of great interest to many NKBA members — perhaps even more so than the actual size of homes — is the number of bathrooms. As one might expect, as homes have become larger, they contain more bathrooms.
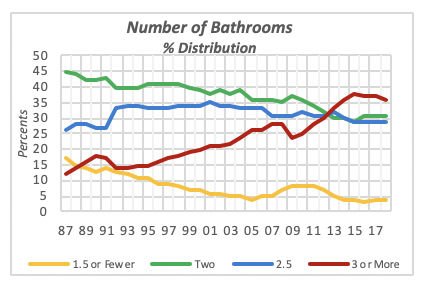
Homes with two or fewer bathrooms have become less prevalent over the last 30 years, shown by the yellow and orange lines in the chart below. While they represented over 60% of the new homes built In 1987, today they are just over one-third (35%). Their loss has been captured by homes with “three or more” bathrooms, which went from one in eight homes (12%) back in 1987, to last year’s 36% of all new homes.
Although the data does not rigorously allow for a precise estimate of the average number of bathrooms per house, a rough approximation using available data is possible.
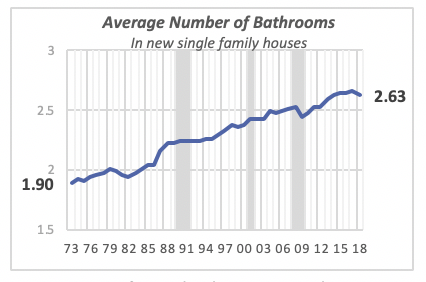
Based on these calculations, it’s estimated that the typical new single-family house has 2.63 bathrooms. The number of bathrooms was just under two in 1973 (1.9 statistically). This means that over the last 45 years, American homes boast almost an additional bathroom.
However, as pointed out above regarding house size, in the last three years, the trend has reversed for the number of bathrooms as well, although the reduction is minimal.
An average of 2.63 bathrooms per house may seem a low figure given the apparent dominance of houses with three, four or even more bathrooms. However, nearly two-thirds of the new homes (64%) have two-and-a-half bathrooms or fewer — the median is between two and two-and-a-half bathrooms.
Mortgage Rates Remain Stable
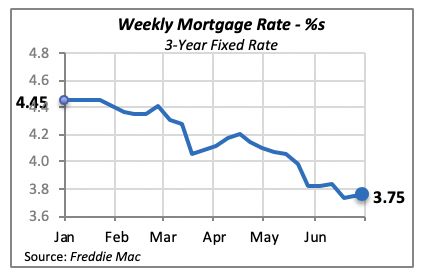
Mortgage rates did not change last week, staying at 3.75% for the 30-year fixed rate. But they are expected to fall over the next couple of weeks, given the recent posture from the Federal Reserve Bank.
While the fear of inflationary pressures has subsided, consumer price inflation has remained under 2% with no indication that it might rise in the near future. The Fed’s concern has turned toward a softening economy, so it might take actions to lower interest rates with the idea that this will give the economy a positive boost.
Manuel Gutierrez, Consulting Economist to NKBA
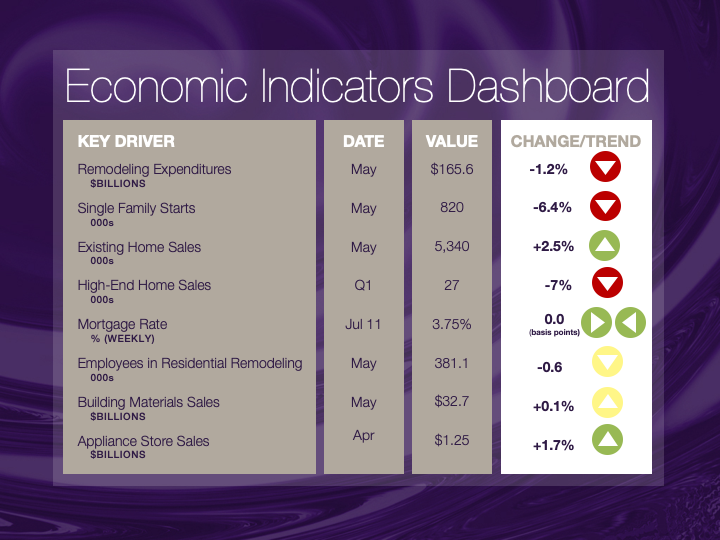
Explanation of NKBA’s Economic Indicators Dashboard
The dashboard displays the latest value of each economic indicator with a colored triangle that highlights visually the recent trend for each of the drivers. “Green” is a positive signal, indicating that the latest value is improving; “Yellow,” as it’s commonly understood, denotes caution because the variable may be changing direction; “Red” indicates that the variable in question is declining, both in its current value and in relation to the recent past.
Note that all the data, except for “mortgage rate” and “appliance-store sales” are seasonally adjusted and are represented at annual rates.
Remodeling Expenditures. This is the amount of money spent on home improvement projects during the month in question. It covers all work done for privately owned homes (excludes rentals, etc.). The data are in billions of dollars and are issued monthly by the U.S. Department of Commerce.
Single-Family Starts. This is the number of single-family houses for which construction was started in the given month. The data are in thousands of houses and are issued monthly by the U.S. Department of Commerce.
Existing-Home Sales. These data are issued monthly by the National Association of Realtors and capture the number of existing homes that were sold in the previous month.
High-End Home Sales. This series are sales of new homes priced at $500,000 and higher. The data are released quarterly by the U.S. Department of Commerce and are not seasonally adjusted. Thus, a valid comparison is made to the same quarter of prior year.
Mortgage Rate. We have chosen the rate on 30-year conventional loans that is issued by the Federal Home Loan Mortgage Corporation (known popularly as Freddie Mac.) Although there are a large number of mortgage instruments available to consumers, this one is still the most commonly used.
Employees in Residential Remodeling. This indicator denotes the number of individuals employed in construction firms that do mostly residential remodeling work.
Building-Materials Sales. These data, released monthly by the Department of Commerce, capture total sales of building materials, regardless of whether consumers or contractors purchased them. However, we should caution that the data also includes sales to projects other than residential houses.
Appliance-Store Sales.This driver captures the monthly sales of stores that sell mostly household appliances; the data are stated at an annual rate. We should not confuse this driver with total appliance sales, since they are sold by other types of stores such as home centers.
We hope you find this dashboard useful as a general guide to the state of our industry. Please contact us at Feedback@nkba.orgif you would like to see further detail.


