

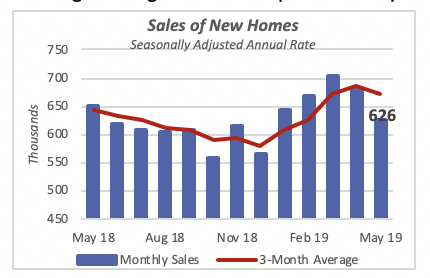
New Home Sales Falter
Sales of new homes fell 7.8% in May to an annual rate of 626,000 units. This is the second consecutive monthly drop, following several months of encouraging increases that suggested a reviving housing market. Compared to May of last year, sales are 4% lower.
Even though the average price of a new home fell last month by 8% to $308,000, the median price was down only 2%. Further, for all practical purposes, house prices have changed little over the last year. The average price in May was just $8,000 less than a year ago, which is 3% lower; the median price of $377,000 this year is just 1% higher than a year ago.
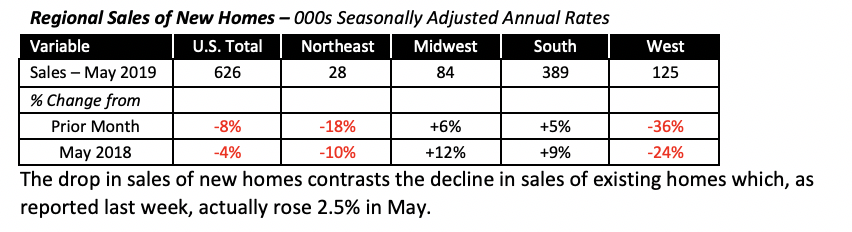
Two of the four regions recorded sizable declines in sales in May. The drop was particularly pronounced in the West, with home sales falling by more than one-third. This decline wiped out the gains in sales seen in the region over the previous four months.
However, sales in the South region, which typically accounts for over half of new home sales in the U.S., rose by 5%, partly compensating the drop in the Northeast and the West.
Greater Increase in Renters vs. Owners
This month marks a decade since the Great Recession of 2008-2009ended; June 2009 has been designated by the National Bureau of Economic Research as the official end of the latest economic recession. The past 10 years has seen a strong recovery in many areas of the economy, particularly the valuation of public companies measured by the various stock markets indices. The recovery has been significantly stronger in the last couple of years.
The number of workers has increased by more than 20 million, an average of two million per year over the decade, rising from 131 million persons employed in mid-2009 to the current 151 million. The unemployment rate has fallen to 3.6%, a low not seen since the late 1960s.
But in some areas of greater interest to the business of NKBA members, such as housing, the recovery has been less-than-spectacular. One area that impacts many members’ businesses is the modest increase in the number of homeowners, who tend to spend more on remodeling and maintenance of their homes than renters.
In fact, since the end of the recession, the number of homeowners has risen by just 5% while the number of renters is up 20%. There are currently an estimated 78.6 million homeowners, an increase of 3.6 million over the last decade. At the same time, the number of renters is currently 43.8 million, or 7.3 million more than in 2009.
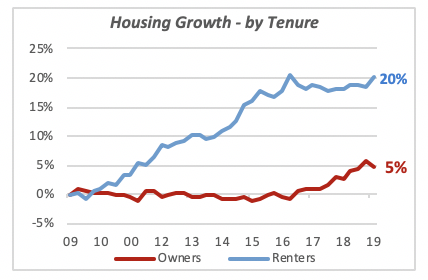
One consequence of the fast growth in the number of renters relative to homeowners is the drop in the homeownership rate from 69% in 2006 to the current 64.2% in the first quarter of this year. The high level of student debt among many young households, who are currently renters, prevents them from jumping to homeownership in the near future.
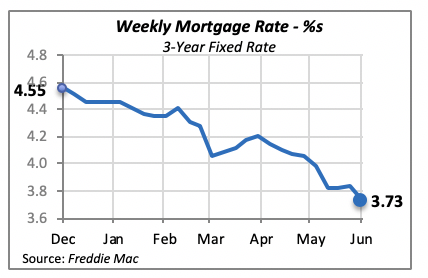
Mortgage Rates Continue to Slide
Last week, the 30-year fixed mortgage rate fell to 3.73%, 11 basis points lower than the week before.
Even though lower mortgage rates should begin to encourage some households to become homeowners, there is concern that the Federal Reserve Bank might take a more aggressive posture regarding monetary policy and begin to raise interest rates.
Manuel Gutierrez, Consulting Economist to NKBA
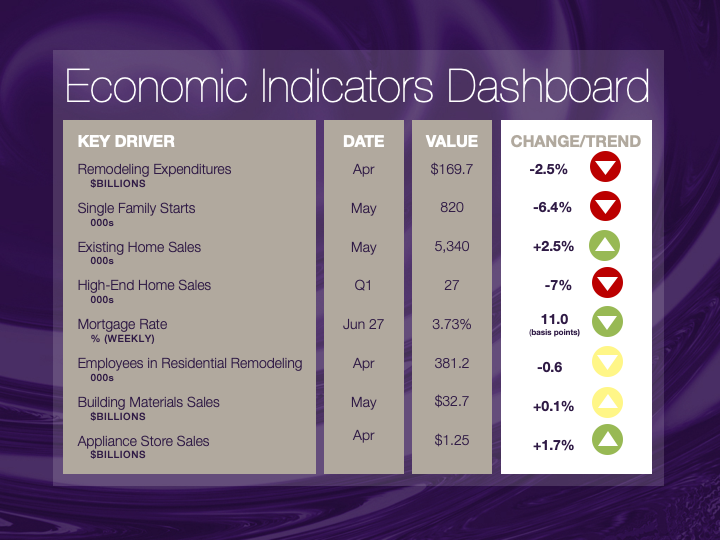
Explanation of NKBA’s Economic Indicators Dashboard
The dashboard displays the latest value of each economic indicator with a colored triangle that highlights visually the recent trend for each of the drivers. “Green” is a positive signal, indicating that the latest value is improving; “Yellow,” as it’s commonly understood, denotes caution because the variable may be changing direction; “Red” indicates that the variable in question is declining, both in its current value and in relation to the recent past.
Note that all the data, except for “mortgage rate” and “appliance-store sales” are seasonally adjusted and are represented at annual rates.
Remodeling Expenditures. This is the amount of money spent on home improvement projects during the month in question. It covers all work done for privately owned homes (excludes rentals, etc.). The data are in billions of dollars and are issued monthly by the U.S. Department of Commerce.
Single-Family Starts. This is the number of single-family houses for which construction was started in the given month. The data are in thousands of houses and are issued monthly by the U.S. Department of Commerce.
Existing-Home Sales. These data are issued monthly by the National Association of Realtors and capture the number of existing homes that were sold in the previous month.
High-End Home Sales. This series are sales of new homes priced at $500,000 and higher. The data are released quarterly by the U.S. Department of Commerce and are not seasonally adjusted. Thus, a valid comparison is made to the same quarter of prior year.
Mortgage Rate. We have chosen the rate on 30-year conventional loans that is issued by the Federal Home Loan Mortgage Corporation (known popularly as Freddie Mac.) Although there are a large number of mortgage instruments available to consumers, this one is still the most commonly used.
Employees in Residential Remodeling. This indicator denotes the number of individuals employed in construction firms that do mostly residential remodeling work.
Building-Materials Sales. These data, released monthly by the Department of Commerce, capture total sales of building materials, regardless of whether consumers or contractors purchased them. However, we should caution that the data also includes sales to projects other than residential houses.
Appliance-Store Sales.This driver captures the monthly sales of stores that sell mostly household appliances; the data are stated at an annual rate. We should not confuse this driver with total appliance sales, since they are sold by other types of stores such as home centers.
We hope you find this dashboard useful as a general guide to the state of our industry. Please contact us at Feedback@nkba.org if you would like to see further detail.


