

Consumer Optimism Jumps
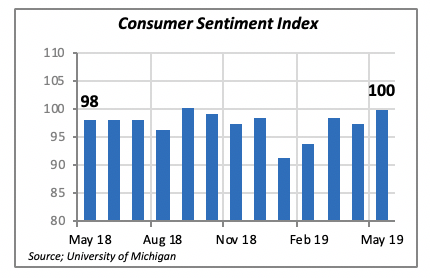
The latest data from the University of Michigan’s monthly sentiment survey reveals consumers are more optimistic, with the index rising nearly 3% in May to reach 100 — although the University reports that confidence was eroding in the last two weeks of May, mainly due to negative references to tariffs.
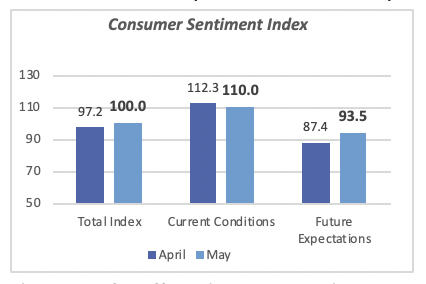
Interestingly, two of the main components underlying the index moved in different directions last month. Consumers’ assessment of current economic conditions deteriorated, falling 2% in May, while the “future expectations” index rose by a robust 7% to 93.5. This is the highest level for future expectations in nearly 16 years. Consumers think that the current spat over tariffs will be resolved favorably for the U.S. economy.
The issue of tariffs is also impacting how consumers expect inflation to develop in the near future. In April, they expected inflation to increase 2.5% over the next year, but talks about rising tariffs have moved these inflation expectations up to 2.9%.
Increases in Home Prices Are Moderating
The general increase in inflation expectations does not translate into faster increases for home prices. While housing prices have continued to increase, they are growing at a much slower pace. A year ago, house prices were increasing at a rate of 6%, but that pace has fallen to under 4% more recently. Month by month, the acceleration of house prices is abating.
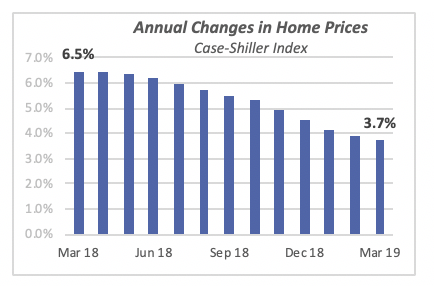
This is a sharp contrast to the fast pace of price increases seen the last few years. Despite the slow post-recession economic recovery, with GDP growth averaging just over 2% annually between 2012 and 2018, housing prices rose at a 6.5% annual average in the same period.
In fact, average home prices had recovered and passed their level before the housing crash in 2006-2008. Today’s house prices are nearly 13% above their peak levels back in 2006, when the Case-Shiller price index reached a value of 184. In March of this year, the index exceeded 207.
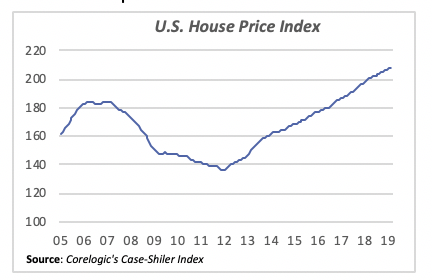
While house prices had dropped nearly one-third by the bottom of the housing recession in 2012, they have recovered more than 50% since then. This recovery of house prices supports rising wealth among Americans who already own a home.
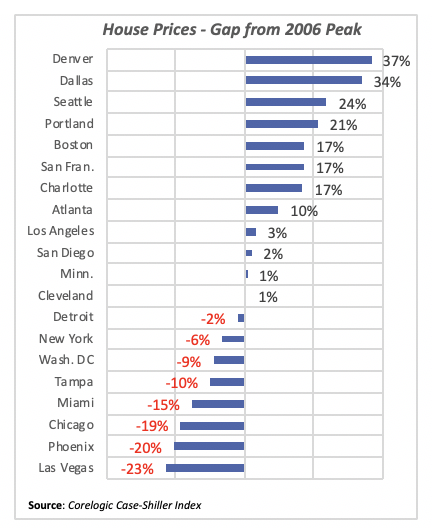
But not all regions of the country have benefited from the spike in home prices. There are still several major metropolitan areas where prices lag their pre-recession peaks. Most notably is Las Vegas, where prices are still 23% lower than they were in 2006. Similarly, Phoenix home prices are 20% lower, and Chicago has yet to fill a 19% gap.
At the other extreme are metro areas like Denver and Dallas, where house prices are more than 30% over their level 13 years ago.
The top 20 metro areas for which house prices are available are listed in the table below, where a positive number signals that house prices today are higher than their previous peak in 2006.
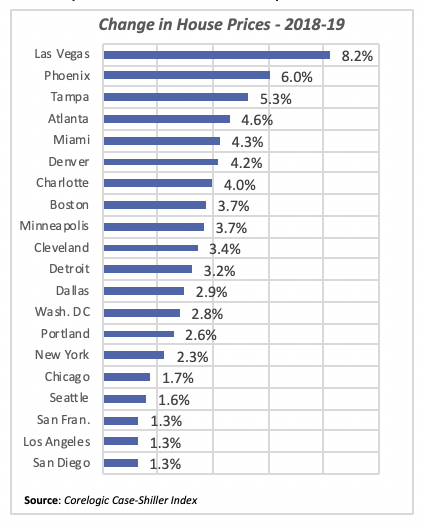
But several metros with the largest house price gap to 2006 are recovering sharply. Over the past 12 months, areas including Las Vegas and Phoenix saw the largest increases in home prices, while some areas with the largest gains over the last 13 years have seen housing price increases soften in the last year.
House price increases for the past 12 months are shown in the table below.
Mortgage Rates Slip Again
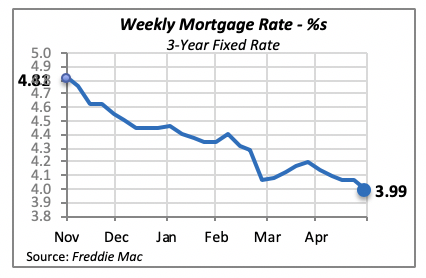
Mortgage rates continue to fall. Last week, the 30-year, fixed mortgage rate declined to 3.99%, seven basis points (0.07%) lower than the previous week. The last time rates were this low was at the end of 2017. Although economists had hoped that lower rates would stimulate the housing markets, there has yet to be such an impact.
Manuel Gutierrez, Consulting Economist to NKBA
Explanation of NKBA’s Economic Indicators Dashboard
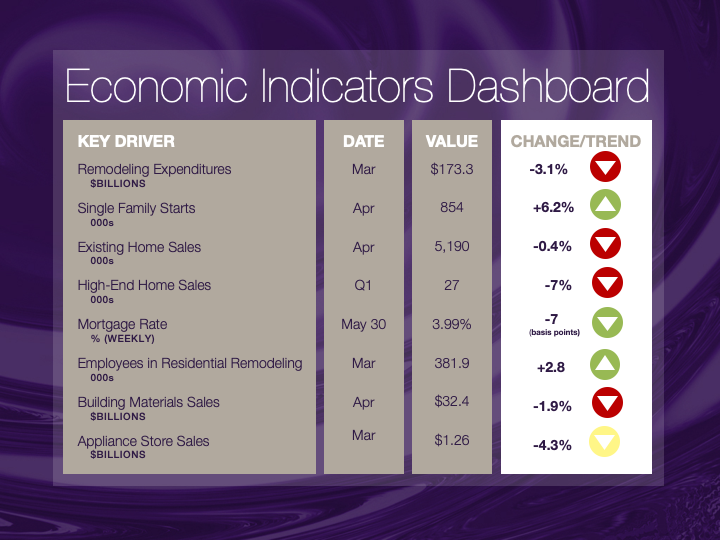
The dashboard displays the latest value of each economic indicator with a colored triangle that highlights visually the recent trend for each of the drivers. “Green” is a positive signal, indicating that the latest value is improving; “Yellow,” as it’s commonly understood, denotes caution because the variable may be changing direction; “Red” indicates that the variable in question is declining, both in its current value and in relation to the recent past.
Note that all the data, except for “mortgage rate” and “appliance-store sales” are seasonally adjusted and are represented at annual rates.
Remodeling Expenditures. This is the amount of money spent on home improvement projects during the month in question. It covers all work done for privately owned homes (excludes rentals, etc.). The data are in billions of dollars and are issued monthly by the U.S. Department of Commerce.
Single-Family Starts. This is the number of single-family houses for which construction was started in the given month. The data are in thousands of houses and are issued monthly by the U.S. Department of Commerce.
Existing-Home Sales. These data are issued monthly by the National Association of Realtors and capture the number of existing homes that were sold in the previous month.
High-End Home Sales. This series are sales of new homes priced at $500,000 and higher. The data are released quarterly by the U.S. Department of Commerce and are not seasonally adjusted. Thus, a valid comparison is made to the same quarter of prior year.
Mortgage Rate. We have chosen the rate on 30-year conventional loans that is issued by the Federal Home Loan Mortgage Corporation (known popularly as Freddie Mac.) Although there are a large number of mortgage instruments available to consumers, this one is still the most commonly used.
Employees in Residential Remodeling. This indicator denotes the number of individuals employed in construction firms that do mostly residential remodeling work.
Building-Materials Sales. These data, released monthly by the Department of Commerce, capture total sales of building materials, regardless of whether consumers or contractors purchased them. However, we should caution that the data also includes sales to projects other than residential houses.
Appliance-Store Sales.This driver captures the monthly sales of stores that sell mostly household appliances; the data are stated at an annual rate. We should not confuse this driver with total appliance sales, since they are sold by other types of stores such as home centers.
We hope you find this dashboard useful as a general guide to the state of our industry. Please contact us at Feedback@nkba.orgif you would like to see further detail.


