

Beginning of an Economic Slowdown?
Many economists are predicting an economic recession in the near future. For some, it’s simply a professionally defensive move that, if a recession materializes, they can claim they called it and thus build a reputation as accurate forecasters. For others, weakness in economic statistics leads them to state that there are clear signals that a recession is on its way. Still others, like me, are not stating an opinion either way because in reality, nobody can predict the future much less the timing of an economic recession. The best we can do is provide analysis and commentary that helps readers understand events better and draw their own conclusions.
As previously noted, several construction statistics are showing weakness, particularly housing sector numbers that are so crucial for our businesses. Also, two types of recently released economic data support this view. One is data on dollars spent for residential construction projects; another is the May employment data released last Friday.
First, a look at the meaning behind construction spending data.
Residential Construction Retrenches
There are many barometers of residential construction, with most of them showing a softening market. (At the end of this section, a table provides data for several key residential construction sector statistics that may be useful in understanding the dynamics).
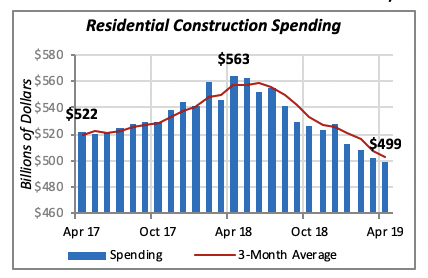
Data on spending for residential construction projects reveal that this sector has been on a steady downward path for a year. In fact, spending by homeowners and residential builders reached a peak in April 2018, when the total was $563 billion. Over the last year, the value of residential construction spending has fallen by 11% to just under $500 billion, which is even lower than what it was two years ago.
Two of the four components making up the residential construction sector — single-family construction and homeowners’ remodeling — are down from last year. Spending for single-family housing, which accounts for over half of total residential spending, hit a $265 billion rate in April and is down 8% from last year. Homeowners’ remodeling is down a sharp 22% from last year, with $170 billion in spending and one-third of total residential.
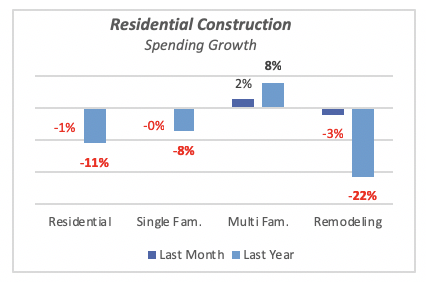
Spending for construction of multifamily housing units is the only category showing signs of life. Spending is up 8% from last year, even though with an annualized rate of $65 billion, it accounts for only 13% of the total. Unfortunately, the series of residential construction statistics does not include any data for remodeling and improvement of rental units, which is the fourth component making up the residential sector.
Note that the remodeling data discussed here originates from the U.S. Department of Commerce, and it differs from that in other sources, such as NKBA’s industry estimates, which are restricted to residential kitchen and bath. Also, this data differs from estimates issued by the Joint Center for Housing Studies (Harvard University), which provides a more comprehensive view of the remodeling market. The Joint Center’s latest report on remodeling can be accessed here.
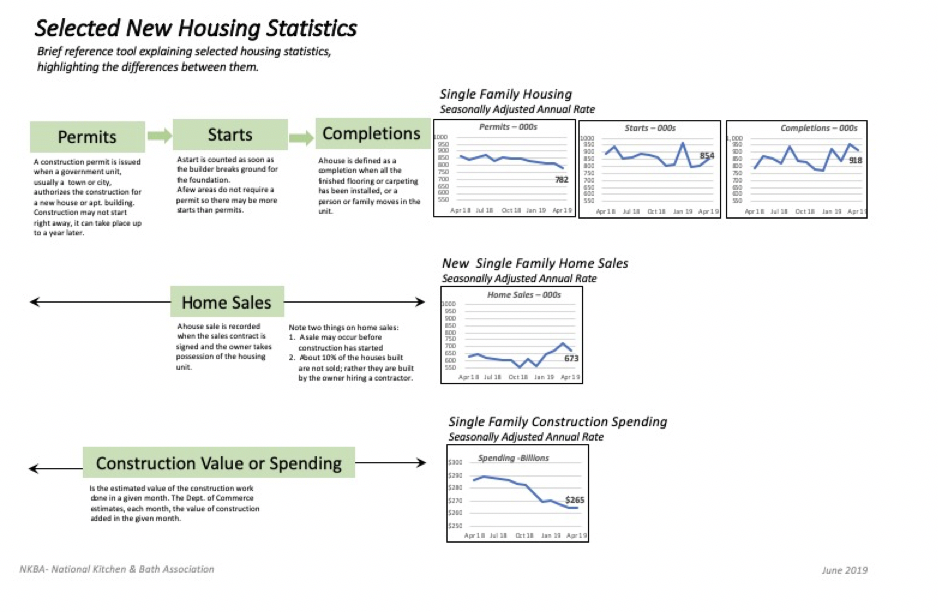
Housing Statistics Explained
The chart below provides several views of the single-family housing market. They help provide a more comprehensive view of the current state of the market.
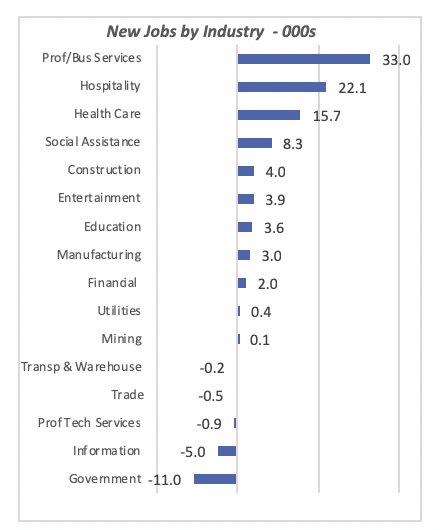
Disappointing Employment Data
It should be noted that in private industry — that is, excluding the government — the new jobs figure is higher, at 90,000 workers. It is unusual that government entities, including Federal, state and local governments, reduce employment.
Both the unemployment and labor participation rates remained unchanged last month. The unemployment rate was 3.6% in May, lowest since the late 1960s. This is good news for workers because it means that anybody who wants a job can easily obtain one; but it’s not necessarily the same for businesses, since they have a harder time finding workers and filling positions.
New jobs were concentrated in three industries, which together accounted for 94% of all new jobs. Professional & Business Services generated an additional 33,000 jobs in May. This sector has been a strong contributor; over the last 12 months it has generated one-fifth of total new jobs, or 498,000.
The Hospitality industry was the second-largest contributor, adding 22,000 jobs in May. Hospitality employment has risen consistently over the last year. However, unlike Professional & Business Services, which provides its workers hourly wages that are 20% above the overall average, hourly wages in Hospitality are 40% lower than the average of all private workers.
The third major contributor was Health Care, which added 15,700 jobs in the month.
Although employment growth may have slowed over the last few months, companies are retaining workers. The number of unemployment claims has not changed over the last few months.
Mortgage Rates Slide Again
The 30-year fixed mortgage rate fell again last week, by 17 basis points to 3.82% — the largest decline in four years, and down nearly a full point since December.
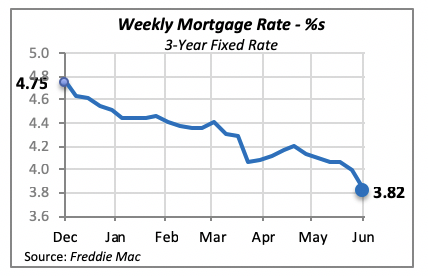
The Federal Reserve Bank appears to be poised to lower interest rates, perhaps inspired by pressure from the administration and the softness of some economic data. Although such a move could result in encouraging further economic growth, whether that translates into gains in the housing market is yet to be seen.
Manuel Gutierrez, Consulting Economist to NKBA
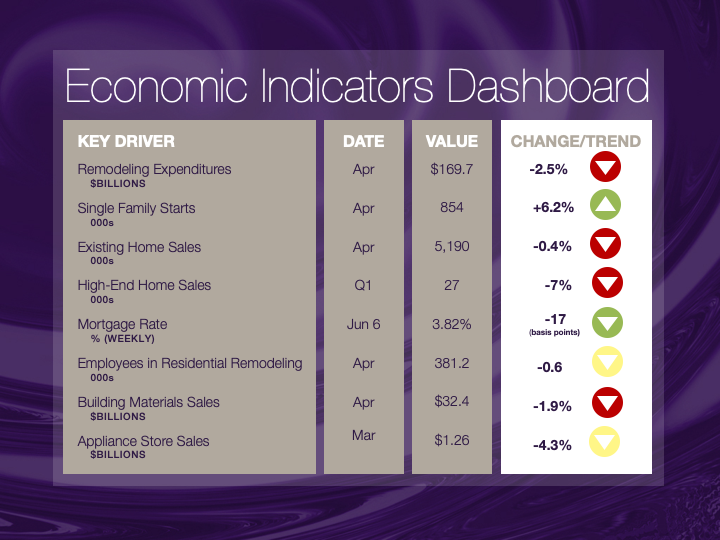
Explanation of NKBA’s Economic Indicators Dashboard
The dashboard displays the latest value of each economic indicator with a colored triangle that highlights visually the recent trend for each of the drivers. “Green” is a positive signal indicating that the latest value is improving; “Yellow,” as it’s common understood denotes caution because the variable maybe changing direction; and “Red” indicates that the variable in question is declining, both in its current value and in relation to the recent past.
Note that all the data, except for “mortgage rate” and “appliance store sales” are seasonally adjusted and are represented at annual rates.
Remodeling Expenditures. This is the amount of money spent on home improvement projects during the month in question. It covers all work done for privately-owned homes (excludes rentals, etc.). The data are in billions of dollars and are issued monthly by the U.S. Department of Commerce.
Single Family Starts. It is the number of single family houses for which construction was started in the given month. The data are in thousands of houses and are issued monthly by the U.S. Department of Commerce.
Existing Home Sales. These data are issued monthly by the National Association of Realtors, and capture the number of existing homes that were sold in the previous month.
High-End Home Sales. This series are sales of new homes priced at $500,000 and over. The data are released quarterly by the U.S. Department of Commerce, and are not seasonally adjusted. Thus a valid comparison is made to the same quarter of prior year.
Mortgage Rate. We have chosen the rate on 30-year conventional loans that is issued by the Federal Home Loan Mortgage Corporation (known popularly as Freddie Mac.) Although there are a large number of mortgage instruments available to consumers, this one is still the most commonly used.
Employees in Residential Remodeling. This indicator denotes the number of individuals employed in construction firms that do mostly residential remodeling work.
Building Materials Sales. These data, released monthly by the Department of Commerce, capture the total sales of building materials, regardless of whether consumers or contractors purchased them. However, we should caution that the data also includes sales to projects other than residential houses.
Appliance Store Sales.This driver captures the monthly sales of stores that sell mostly household appliances; the data are stated at an annual rate. We should not confuse this driver with total appliance sales, since they are sold by other types of stores such as Home Centers, for instance.
We hope that you find this dashboard useful as a general guide to the state of our industry. Please contact us if you would like to see further details.%


