

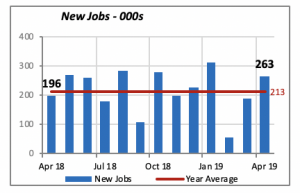
Employment Picture Is Bright
April brought good news on employment with the announcement of 263,000 jobs added in the month. This is higher than the monthly average of 213,000 jobs seen over the previous year (highlighted by the red line in the chart below,) and brings the total jobs added in the latest 12 months to 2.62 million. This is more than 300,000 jobs than were created in the 12 months ending in April 2018.
The major contributors to job growth were Professional & Business Services (which added 76,000 jobs or 29% of the total), Construction(+33,000), Government (+27,000), Health Care (+27,000), Social Assistance (+26,000) and Hospitality(+24,000).
At the same time, hourly wages rose 3.4% over the last 12 months and the unemployment rate fell 0.2% to 3.6%. As it has been heralded widely in the press and TV, this is the lowest rate since the late 60s, a truly remarkable achievement.
However, there are clouds in any sunny sky. One is the drop in the labor participation rate — that is, the percentage of the working-age population that is either working or looking for a job. That rate fell to 62.8% in April, which may be a reason for the unemployment rate falling, although the participation rate has hovered in the 62.4%-to-63% range for the last six years.
Also, while some may argue that one reason for the decline in participation is due to baby boomers reaching retirement age and leaving the labor force, the data tells a different story. The participation rate for people 65 years and older dropped by half between 1960 and the late 1980s, from around 20% to roughly 10.5%. But since then, it has risen more or less steadily to the current 19.8%. The conclusion is that retired people are returning to the labor force (or not leaving).
The overall participation rate had increased since the 1960s from 58% to a high of 67.3% at the turn of the 21stcentury. Since that time, however, the rate declined to 62.5% by mid-2015, when it stabilized around that rate.
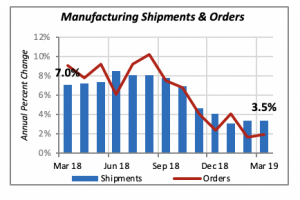
Manufacturing Shipments Rise
Total manufacturing shipments rose 0.7% in March to reach $510 billion for the month, while at the same time, orders jumped a surprising 1.9% to $508 billion.
Despite this spurt, the rate of increase for orders as well as shipments has been declining over the last year. While manufacturing shipments, for instance, had been increasing around 7% to 8% a year ago, the latest data show increases at half that rate — 3% to 4%. New orders follow a similar pattern.
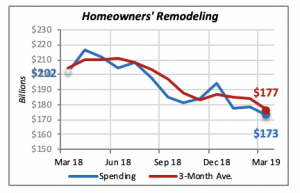
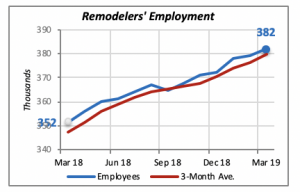
Remodeling Market Sends Mixed Signals
As is often the case, economic data do not always behave as expected. Thus, this month two measures of the remodeling market — employment in remodeling businesses and homeowners’ spending for home improvements — offer conflicting signals.
First, remodeling spending fell in March by 3.1% to an annual rate of $173.3 billion. This is a further drop in what has been a more or less steady decline over the last year. In fact, today’s spending is 14% lower than in March of last year, when homeowners were remodeling at a rate of $202 billion.
But following this dismal news, last Friday’s data revealed that business firms engaged in remodeling projects increased their employment by adding another 2,800 workers to their rolls. Remodeling firms are enjoying booming times, and this is reflected in their employment, which has increased by 10% over the last 12 months.
How are these two conflicting views of the remodeling market reconciled? One thing to consider is that the homeowner spending data is based upon estimates and forecasts using the Bureau of Labor Statistics’ “Consumer Expenditure Survey.” The data is subject to substantial revisions in the following months, as well as once a year in May when data from the previous year is revised.
The second point to consider is that both do not measure exactly the same thing. The spending data reflects expenditures for homeowners’ remodeling only; that is, it excludes spending for rental properties, which represent 36% of all houses that are occupied. The employment data includes businesses that are involved in remodeling for all types of properties, including commercial properties such as hotels or office buildings.
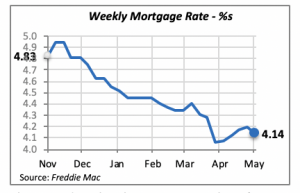
Mortgage Rates Slip
The 30-year fixed mortgage rate eased down slightly last week, falling by six basis points to 4.14%. It still remains favorable for home purchasing, although, as we know, there are other factors such as student debt that prevent potential buyers from entering the housing markets.
The President has been putting a lot of pressure on the Fed not to increase interest rates. Many economists hope that the Fed will ignore these pressures and take policy actions, such as raising rates, based on economic fundamentals, and maintain a semblance of acting independently.
Manuel Gutierrez, Consulting Economist to NKBA
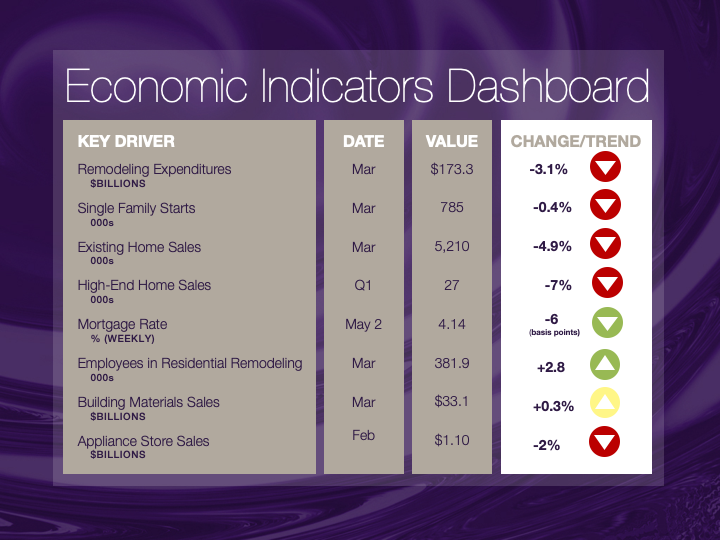
Explanation of NKBA’s Economic Indicators Dashboard
The dashboard displays the latest value of each economic indicator with a colored triangle that highlights visually the recent trend for each of the drivers. “Green” is a positive signal, indicating that the latest value is improving; “Yellow,” as it’s commonly understood, denotes caution because the variable may be changing direction; “Red” indicates that the variable in question is declining, both in its current value and in relation to the recent past.
Note that all the data, except for “mortgage rate” and “appliance-store sales” are seasonally adjusted and are represented at annual rates.
Remodeling Expenditures. This is the amount of money spent on home improvement projects during the month in question. It covers all work done for privately owned homes (excludes rentals, etc.). The data are in billions of dollars and are issued monthly by the U.S. Department of Commerce.
Single-Family Starts. This is the number of single-family houses for which construction was started in the given month. The data are in thousands of houses and are issued monthly by the U.S. Department of Commerce.
Existing-Home Sales. These data are issued monthly by the National Association of Realtors and capture the number of existing homes that were sold in the previous month.
High-End Home Sales. This series are sales of new homes priced at $500,000 and higher. The data are released quarterly by the U.S. Department of Commerce and are not seasonally adjusted. Thus, a valid comparison is made to the same quarter of prior year.
Mortgage Rate. We have chosen the rate on 30-year conventional loans that is issued by the Federal Home Loan Mortgage Corporation (known popularly as Freddie Mac.) Although there are a large number of mortgage instruments available to consumers, this one is still the most commonly used.
Employees in Residential Remodeling. This indicator denotes the number of individuals employed in construction firms that do mostly residential remodeling work.
Building-Materials Sales. These data, released monthly by the Department of Commerce, capture total sales of building materials, regardless of whether consumers or contractors purchased them. However, we should caution that the data also includes sales to projects other than residential houses.
Appliance-Store Sales.This driver captures the monthly sales of stores that sell mostly household appliances; the data are stated at an annual rate. We should not confuse this driver with total appliance sales, since they are sold by other types of stores such as home centers.
We hope you find this dashboard useful as a general guide to the state of our industry. Please contact us at Feedback@nkba.org if you would like to see further detail.


