

Tariffs: A Lose-Lose Deal
The trade impasse between the Trump administration and China continues without any sign of either side making concessions. As is the case with most trade disputes, there are no winners. There are few areas in which most economists agree, but one of them is that in foreign trade tariffs hurt both countries.
Consumers in the country that imposes tariffs on foreign goods, in this case the U.S., end up paying higher prices simply because the cost of the tariff is not absorbed by the exporting country. The tariffs are paid by consumers and businesses in the importing country. At the same time, the country that sees its exports hit by the tariffs, China currently, will see a decline in exports because its goods are more expensive in the importing country. The businesses in China that make those products will have to curtail production and will be forced to lay off workers. So, imposing tariffs is a lose-lose proposition. Nobody wins.
The latest trade figures reveal that the trade balance rose by 1.5% in March to reach $50 billion. Despite this small increase, the trade balance through March is running almost 4% lower than the same period last year.
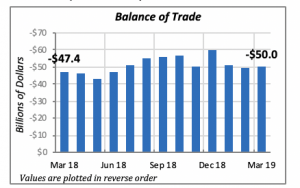
Total U.S. imports through March are $779 billion, 1% higher than what they were last year. Year-to-date exports amount to $629 billion, 2.3% above the same period last year. The difference gives us a trade gap of $150 billion. This gap is closed by payment to foreigners with dollars. This is the so-called “payments balance,” which is the counterpart to the “trade balance.”
Retail Sales Bounce Back
Total retail sales rose by 3.6% in March, partly reversing a declining trend in sales since last August — illustrated by the red line in the chart below. Despite this increase, it is clear that the pace of retail sales growth has slowed markedly over the past six months.

Current sales growth is lower than the 5.1% seen in March 2018. In fact, growth over the last quarter is also lower than average growth in the previous nine months.
Within individual product categories, leading with the fastest growth are Health & Personal Carestores sales that in March were 4.4% higher than a year before. But this group is a small component of retail sales, representing less than 6% of the total.
Other areas with above-average sales growth are Restaurants and sales of Vehicles & Parts, growing at 4.3% and 3.8% each, respectively. The latter —sales at Vehicles & Parts stores — are the largest components of retail sales, accounting for 20% of all retail dollars spent.
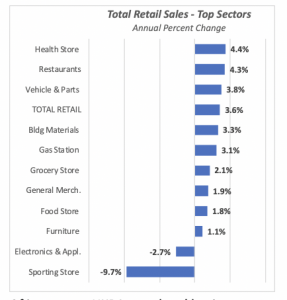
Of interest to NKBA members’ businesses are sales of Building Materials, which came in slightly lower than the average with a 3.3% increase over last year. But they also represent a small proportion with just over 6% of all retail sales.
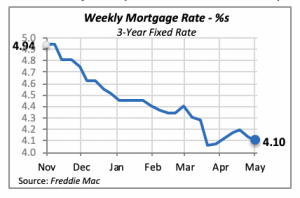
Mortgage Rates Slip Again
Th 30-year, fixed mortgage rate eased down further last week, falling by four basis points to 4.1%. Even though the hope is that lower rates may entice more housing starts and home sales, other factors appear to be preventing consumers from entering the market. One of the more obvious factors is the level of student debt that many young people carry that makes it difficult to start the journey toward homeownership.
Manuel Gutierrez, Consulting Economist to NKBA
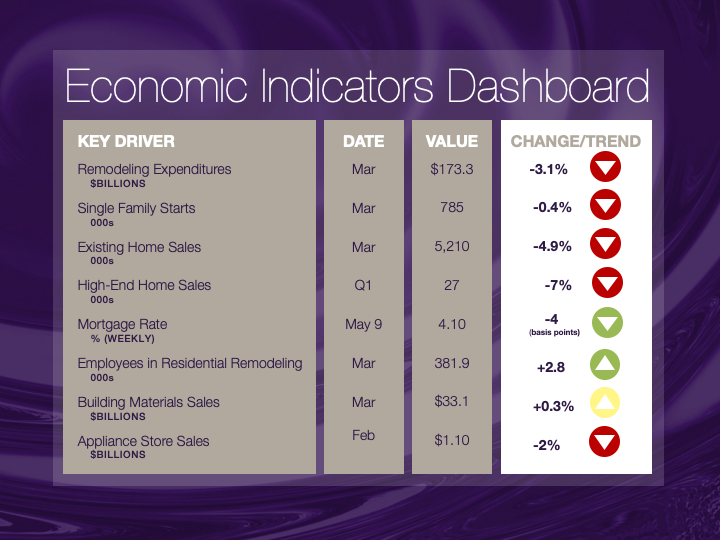
Explanation of NKBA’s Economic Indicators Dashboard
The dashboard displays the latest value of each economic indicator with a colored triangle that highlights visually the recent trend for each of the drivers. “Green” is a positive signal, indicating that the latest value is improving; “Yellow,” as it’s commonly understood, denotes caution because the variable may be changing direction; “Red” indicates that the variable in question is declining, both in its current value and in relation to the recent past.
Note that all the data, except for “mortgage rate” and “appliance-store sales” are seasonally adjusted and are represented at annual rates.
Remodeling Expenditures. This is the amount of money spent on home improvement projects during the month in question. It covers all work done for privately owned homes (excludes rentals, etc.). The data are in billions of dollars and are issued monthly by the U.S. Department of Commerce.
Single-Family Starts. This is the number of single-family houses for which construction was started in the given month. The data are in thousands of houses and are issued monthly by the U.S. Department of Commerce.
Existing-Home Sales. These data are issued monthly by the National Association of Realtors and capture the number of existing homes that were sold in the previous month.
High-End Home Sales. This series are sales of new homes priced at $500,000 and higher. The data are released quarterly by the U.S. Department of Commerce and are not seasonally adjusted. Thus, a valid comparison is made to the same quarter of prior year.
Mortgage Rate. We have chosen the rate on 30-year conventional loans that is issued by the Federal Home Loan Mortgage Corporation (known popularly as Freddie Mac.) Although there are a large number of mortgage instruments available to consumers, this one is still the most commonly used.
Employees in Residential Remodeling. This indicator denotes the number of individuals employed in construction firms that do mostly residential remodeling work.
Building-Materials Sales. These data, released monthly by the Department of Commerce, capture total sales of building materials, regardless of whether consumers or contractors purchased them. However, we should caution that the data also includes sales to projects other than residential houses.
Appliance-Store Sales.This driver captures the monthly sales of stores that sell mostly household appliances; the data are stated at an annual rate. We should not confuse this driver with total appliance sales, since they are sold by other types of stores such as home centers.
We hope you find this dashboard useful as a general guide to the state of our industry. Please contact us at Feedback@nkba.org if you would like to see further detail.


