

Indicators Point to Solid Economy
There is no denying that last week brought much good economic news. Consider this:
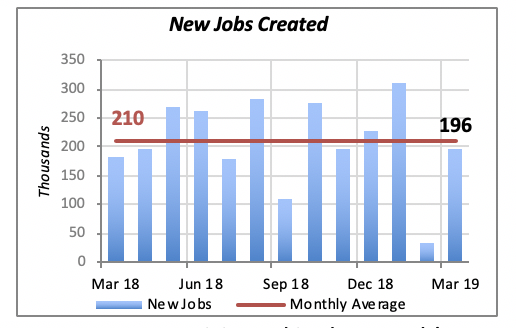
- A total of 196,000 new jobs were added in March;
- Claims for unemployment benefits fell to 213,500 the last week of March;
- The unemployment rate remained stable at 3.8%;
- Hourly wages have risen 3.3% over the last 12 months, the best since 2009;
- The residential remodeling market remains strong and growing — February marked the fourth consecutive month of growth in homeowner remodeling spending;
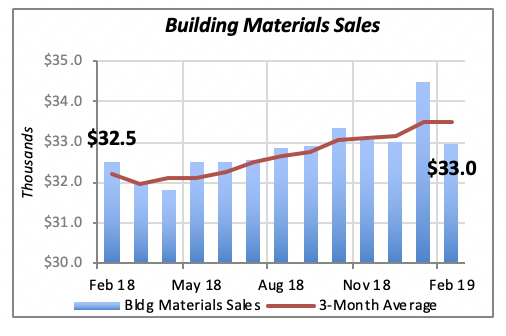
- Although sales of building materials fell in February, it appears that they fell from an unusual jump the prior month; that is, they returned to a normal level;
- Mortgage rates remain favorable for consumers to borrow and finance the purchase of a new or existing home;
- Consumers view the economic environment and their financial situation more favorably; the University of Michigan’s Index of Consumer Sentimentrose nearly 5% in March;
U.S. Economy Continues to Generate Jobs
The total of 196,000 new jobs created in March was a welcome jump from the dismal 33,000 added in February. In fact, March employment growth was nearing the monthly average of 210,000 new jobs of the last year.
Most sectors participated in the month’s growth. Leading them was Health Care, which added over 49,000 jobs, accounting for a quarter of the total. This was followed by Professional & Business services, which added 37,000 jobs. Hospitality added nearly 27,000 positions and, closer to home, Construction jobs increased by 16,000.
These four sectors represent almost two-thirds of last month’s job growth. More importantly, however, is the fact that with the exception of Hospitality, the other three generate above-average earnings among all sectors.
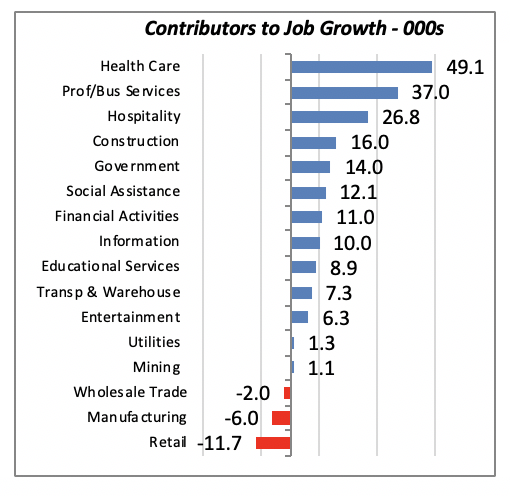
There are some exceptions, of course. Retailing saw its employment rolls reduced by nearly 12,000 in March. Given the state of the retail sector, it’s not surprising to see that total employment has fallen by just under 36,000 over the last year.
Other sectors posting losses in March were Manufacturing, down by 6,000 for the month, and Wholesale trade, which contracted by 2,000 workers. However, employment in these two sectors has increased substantially over the last year; the March decline may only be a temporary situation.
Robust Performance in Remodeling Market
Two measures of the health of the remodeling market — employment by remodeling businesses and spending on remodeling projects — grew positively last month.
Employment by remodeling firms rose by 1,700 to reach nearly 380,000 workers in February (the latest month for which data are available).
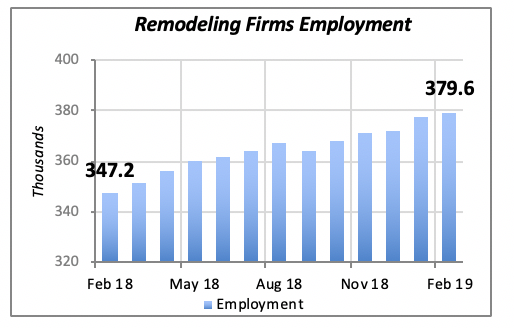
As clearly seen in the chart above, employment by remodeling firms has increased virtually every month over the last year. In fact, employment today is almost 10% higher than its level in February 2018, up more than 32,000 jobs in 12 months. These data reflect businesses engaged in all types of remodeling work, both residential and non-residential.
Spending for remodeling projects also grew in February, by 3.6% to reach an annual rate of $208.4 billion. But, as the chart below shows, growth in remodeling spending has not been steady over the last 12 months. Spending actually fell throughout most of last year, only to reverse course in October. February marks the fourth consecutive month of gains in spending.
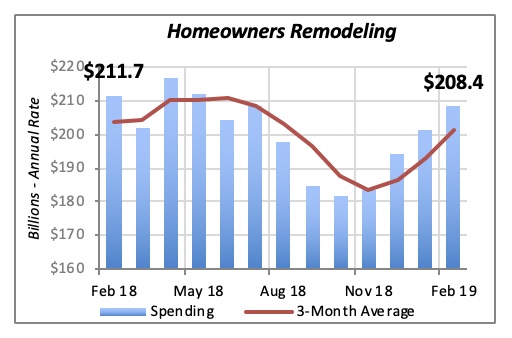
This remodeling spending data reflects only spending by homeowners on their own properties, and excludes remodeling expenditures by owners of multifamily properties, as well as any remodeling or improvement done on commercial buildings.
Building Materials Sales Slip
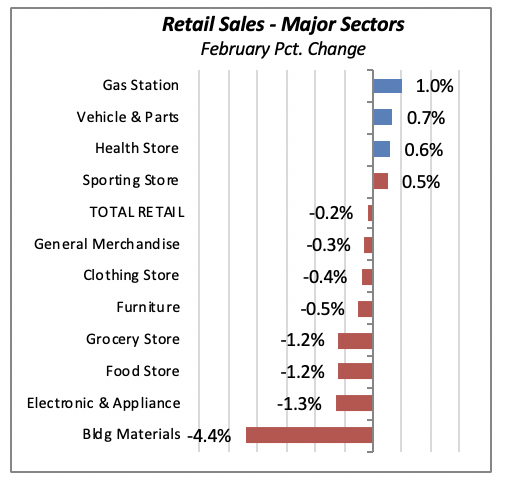
On the negative side, total retail sales fell in February, although by a minimal 0.2% decline. The decline is fairly broad-based: the only significant exceptions were at gas stations,where sales are naturally driven by rising world oil prices; sales of vehicles and parts, and sales in health retailers (e.g., pharmacies).
All other areas posted declines, with the largest drop occurring in sales of Building Materials, which fell a whopping 4.4% for the month.
However, the February decline in sales at building material stores followed a sharp increase in January.
Mortgage Rates Stall
Mortgage rates reversed direction last week, but only modestly. The 30-year fixed mortgage rate rose two basis points (0.02%) to 4.08%, virtually the same as the previous week.
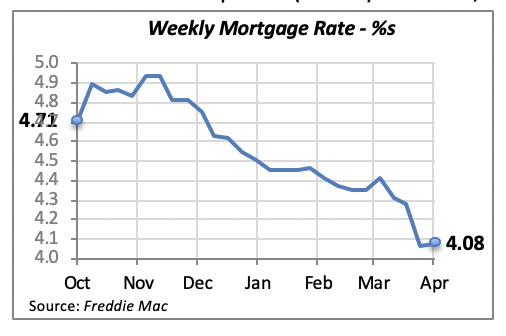
Obviously, the direction that mortgage rates — and interest rates in general — will take over the next few months is unclear. Federal Reserve Bank Chairman Powell and other officials of the Fed send signals of a more cautious stance in the near future. But at the same time, the White House is vociferously asking for lower rates, presumably to boost the economy.
Manuel Gutierrez, Consulting Economist to NKBA
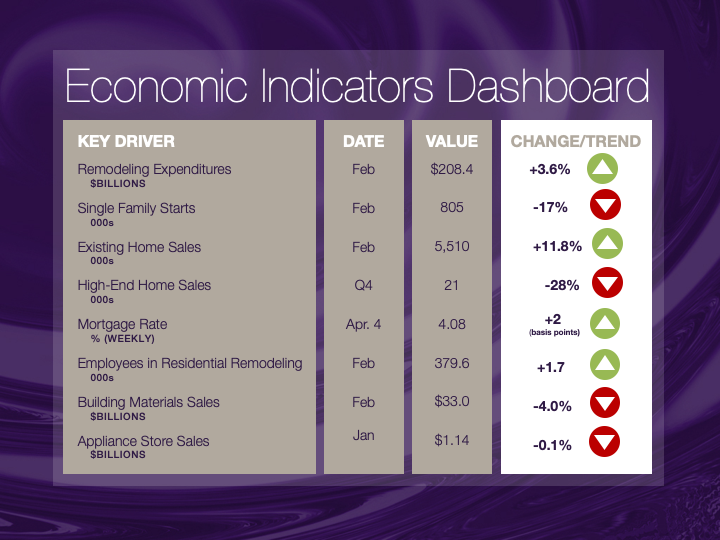
Explanation of NKBA’s Economic Indicators Dashboard
The dashboard displays the latest value of each economic indicator with a colored triangle that highlights visually the recent trend for each of the drivers. “Green” is a positive signal, indicating that the latest value is improving; “Yellow,” as it’s commonly understood, denotes caution because the variable may be changing direction; “Red” indicates that the variable in question is declining, both in its current value and in relation to the recent past.
Note that all the data, except for “mortgage rate” and “appliance-store sales” are seasonally adjusted and are represented at annual rates.
Remodeling Expenditures. This is the amount of money spent on home improvement projects during the month in question. It covers all work done for privately owned homes (excludes rentals, etc.). The data are in billions of dollars and are issued monthly by the U.S. Department of Commerce.
Single-Family Starts. This is the number of single-family houses for which construction was started in the given month. The data are in thousands of houses and are issued monthly by the U.S. Department of Commerce.
Existing-Home Sales. These data are issued monthly by the National Association of Realtors and capture the number of existing homes that were sold in the previous month.
High-End Home Sales. This series are sales of new homes priced at $500,000 and higher. The data are released quarterly by the U.S. Department of Commerce and are not seasonally adjusted. Thus, a valid comparison is made to the same quarter of prior year.
Mortgage Rate. We have chosen the rate on 30-year conventional loans that is issued by the Federal Home Loan Mortgage Corporation (known popularly as Freddie Mac.) Although there are a large number of mortgage instruments available to consumers, this one is still the most commonly used.
Employees in Residential Remodeling. This indicator denotes the number of individuals employed in construction firms that do mostly residential remodeling work.
Building-Materials Sales. These data, released monthly by the Department of Commerce, capture total sales of building materials, regardless of whether consumers or contractors purchased them. However, we should caution that the data also includes sales to projects other than residential houses.
Appliance-Store Sales.This driver captures the monthly sales of stores that sell mostly household appliances; the data are stated at an annual rate. We should not confuse this driver with total appliance sales, since they are sold by other types of stores such as home centers.
We hope you find this dashboard useful as a general guide to the state of our industry. Please contact us if you would like to see further detail.


