

Housing Markets Disappoint
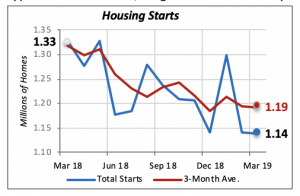
Although housing starts were virtually unchanged last month, slipping just 0.3% to an annualized rate of 1.14 million units, they reached their lowest level in nearly two years. In fact, were it not for a spike in January, when total starts unexpectedly reached an annualized rate of 1.3 million units, the three-month moving average would definitely show a clearly declining trend. Both types of new homes, single- and multifamily units, changed little for the month.
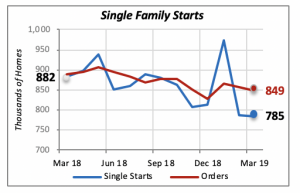
Single-family starts fell by a minimal 0.4% in March to a rate of 785,000 units. This is the lowest pace of single-family construction in well over two years. We have to look back to September 2016, when single-family starts were on an annual pace of 758,000 units, to find a lower level of activity.
Construction of multifamily housing units came in at 354,000 units (annualized) in March, unchanged from the previous month.

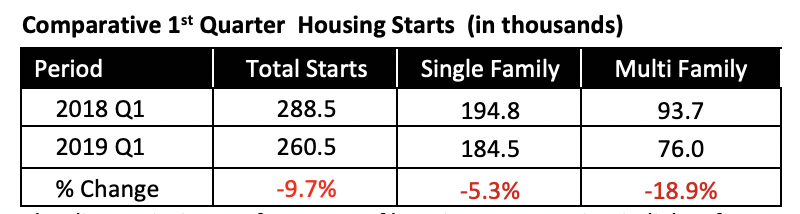
But year-to-date for the first quarter, total housing starts are running nearly 10% below last year. This is the result of a 5.3% drop in single-family starts, combined with a more sizable 19% decline in first quarter multifamily starts. Multifamily starts typically fluctuate sharply from month to month.
The disappointing performance of housing construction in light of generally robust economic news is puzzling. Job growth continues at record levels, adding on average more than 200,000 new jobs a month over the last five years, although the pace has slowed to 180,000 in the last three months. The unemployment rate remains also at record low levels, posting 3.8% in March.
At the same time, claims for unemployment benefits fell down last week to just over 201,000, a figure last seen in the 1960s. This figure is remarkable, since employment at that time was less than half of today’s 150 million persons working.
Additionally, the number of job openings fell by 7% in February. This is the first sizable decline in quite some time, which perhaps portends that businesses are not expanding as fast as they were the last few months.
Despite these favorable factors, however, the number of job openings fell by 7% in February. This is the first sizable decline in quite some time, which perhaps portends that businesses are not expanding as fast as they were the last few months.
Mortgage Rates Edge Up
The old saying “third time is a charm” does not work well for the mortgage-rate market. For the third consecutive week, the 30-year fixed mortgage rate increased 0.05% to 4.17%.

Although the increases are relatively small, they could begin to put additional pressure on housing construction and home sales. Any increase in mortgage rates makes purchasing a home less affordable for some segment of the population. Particularly vulnerable are the millions of young people who are currently burdened with student loan debt.
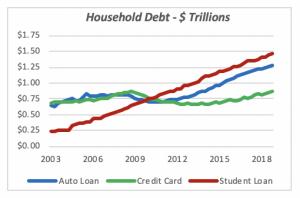
Since 2009, student debt has become the second-most sizable item in households’ balance sheets, behind mortgage debt. Student debt, as illustrated in the chart above, has risen steadily since the beginning of the 21st century, exceeding both auto and credit card debt. Well over 33% of individuals age 20 to 30, who are likely to form a household and perhaps purchase a home, carry student debt. This burden often prevents them from being able to take on additional debt in the form of a mortgage loan.
Manuel Gutierrez, Consulting Economist to NKBA
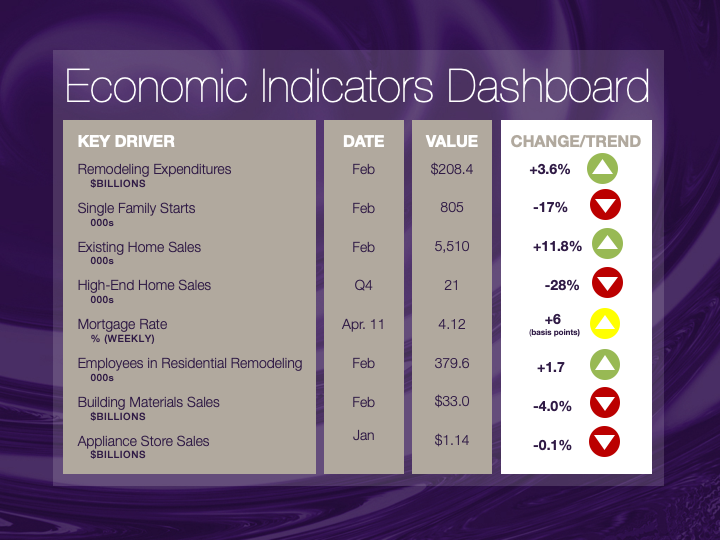
Explanation of NKBA’s Economic Indicators Dashboard
The dashboard displays the latest value of each economic indicator with a colored triangle that highlights visually the recent trend for each of the drivers. “Green” is a positive signal, indicating that the latest value is improving; “Yellow,” as it’s commonly understood, denotes caution because the variable may be changing direction; “Red” indicates that the variable in question is declining, both in its current value and in relation to the recent past.
Note that all the data, except for “mortgage rate” and “appliance-store sales” are seasonally adjusted and are represented at annual rates.
Remodeling Expenditures. This is the amount of money spent on home improvement projects during the month in question. It covers all work done for privately owned homes (excludes rentals, etc.). The data are in billions of dollars and are issued monthly by the U.S. Department of Commerce.
Single-Family Starts. This is the number of single-family houses for which construction was started in the given month. The data are in thousands of houses and are issued monthly by the U.S. Department of Commerce.
Existing-Home Sales. These data are issued monthly by the National Association of Realtors and capture the number of existing homes that were sold in the previous month.
High-End Home Sales. This series are sales of new homes priced at $500,000 and higher. The data are released quarterly by the U.S. Department of Commerce and are not seasonally adjusted. Thus, a valid comparison is made to the same quarter of prior year.
Mortgage Rate. We have chosen the rate on 30-year conventional loans that is issued by the Federal Home Loan Mortgage Corporation (known popularly as Freddie Mac.) Although there are a large number of mortgage instruments available to consumers, this one is still the most commonly used.
Employees in Residential Remodeling. This indicator denotes the number of individuals employed in construction firms that do mostly residential remodeling work.
Building-Materials Sales. These data, released monthly by the Department of Commerce, capture total sales of building materials, regardless of whether consumers or contractors purchased them. However, we should caution that the data also includes sales to projects other than residential houses.
Appliance-Store Sales.This driver captures the monthly sales of stores that sell mostly household appliances; the data are stated at an annual rate. We should not confuse this driver with total appliance sales, since they are sold by other types of stores such as home centers.
We hope you find this dashboard useful as a general guide to the state of our industry. Please contact us if you would like to see further detail.


