

Sales of New High-End Homes Stagnate
After several years of growth, sales of high-end new homes, i.e., those selling for $500,00 or more, were virtually flat last year at 113,000 homes sold, an increase of only 1,000 houses sold at this price from 2017.
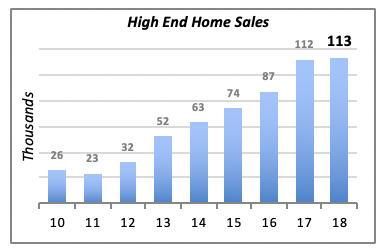
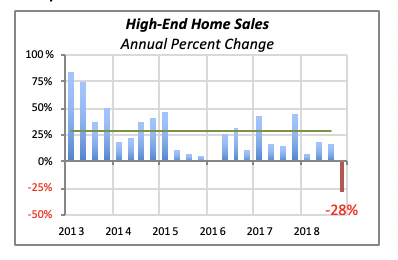
Last year’s 1 percent gain in high-end home sales is disappointing in light of the increases in each of the preceding five years, when the annual increase averaged more than 30%. And there were some years, such as 2013, when home sales jumped far more than the average.
While sales in the first three quarters of last year were positive, it was in the fourth quarter when new high-end home sales growth stalled. In fact, as can be seen in the chart below, sales actually fell in the fourth quarter by 28% — the first decline in high-end home sales in more than five years.
All New-Home Sales Were Mixed
At the same time, sales of new homes in all price ranges also fell in the fourth quarter, but by a more modest 2.6%. Sales of new homes for the year in total, however, rose by 1.5% to 622,000 units.
The performance among regions was dissimilar, with sales in the Midwest and the South increasing, while those in the Northeast and West fell. Sales in the Midwest rose by 5.6% to 79,000, and in the South, they were up 3.5% to 351,000 homes sold. The other two regions saw declines in homes sales last year; more sharply the Northeast, where they fell 17.5% to 33,000 homes, while the West declined marginally by 0.6% to 162,000 homes sold.
Employment Sputters
Contrasting last month’s euphoria emanating from the news of more than 300,000 jobs added in January, February’s dismal news of only 20,000 net new jobs created was received with much less enthusiasm.
A few economic sectors contributed to the 20,000 new jobs. The biggest contributors were Professional Business Services (+42,000 new jobs added), Health Care (+21,000), and Financial Activities (+11,000). At the same time, Construction employment fell by 32,000 in the month, Education jobs were down by 19,000 and Retail Trade shrank 6,000.
February data on job growth in remodeling is released one month after overall employment news. But in January, the number of workers in remodeling activities rose by 4,400.
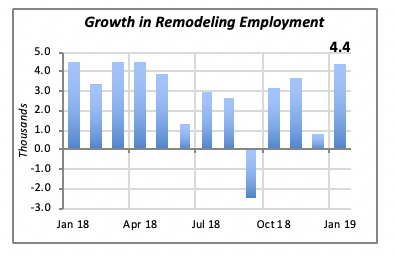
Note that the growth in remodeling jobs in January was consistent with the overall growth in total employment. The report on February remodeling jobs will demonstrate the impact of the low growth in total jobs for the month.
But while fewer jobs were created in February, the unemployment rate still fell to 3.8% — a drop of 0.2% from January’s 4%. This means an additional 300,000 unemployed people joined the employment rolls. This includes full-time, part-time and contract workers.
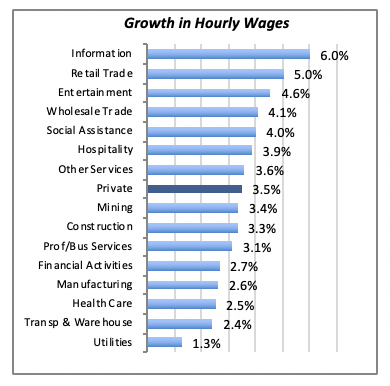
Also, wages have continued to rise, albeit by a small percentage. The average hourly wage of all private workers was 3.5% higher in February than a year before — 1 percentage point higher than the increases of a year ago, when wages were rising at around 2.5% annually. Additionally, the increase in wages is favorable in light of the low inflation rate; prices are rising at 1.5% annually, which translates into workers earning 2% above the rate of inflation.
But there are large differences in wage growth between industries or economic sectors. Informationand, curiously, Retail Trade lead with the highest growth in hourly wages at 6% and 5%, respectively.
At the other extreme is wage growth in Utilitiesof just 1.5%, equal to the inflation rate, meaning that workers in this sector don’t see any change in their financial status. Also, both Construction(+3.3%) and Manufacturing(+2.6%) posted annual wage increases below the overall average of 3.5%.
Modest Uptick on Mortgage Rates
The 30-year, fixed mortgage rate rose by six basis points (0.06%) last week to 4.41% — the first measurable increase following continuous declines since November of last year.
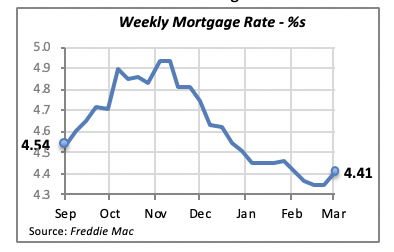
Of course, it’s impossible to predict with certainty whether this increase forebodes a real reversal in rates, or if it’s just a temporary situation. But the apparent softening of the economy, e.g. GDP rising only 2.6% last quarter and the above-mentioned weak job growth, points to weak demand for mortgage loans.
Manuel Gutierrez, Consulting Economist to NKBA
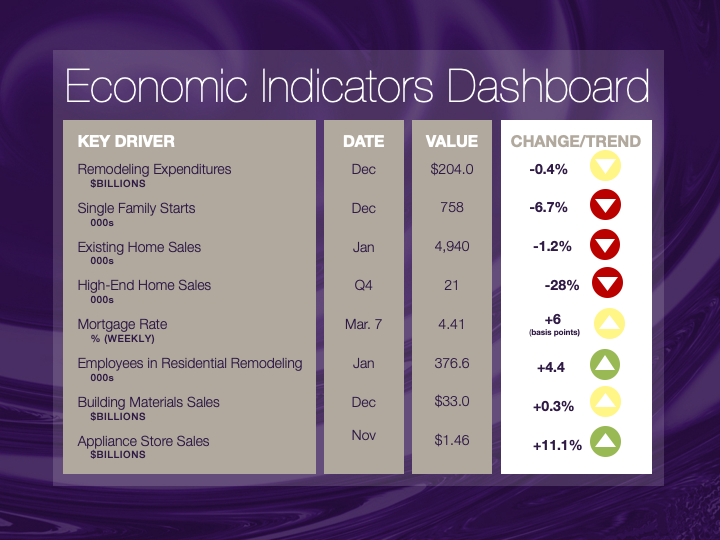
Explanation of NKBA’s Economic Indicators Dashboard
The dashboard displays the latest value of each economic indicator with a colored triangle that highlights visually the recent trend for each of the drivers. “Green” is a positive signal, indicating that the latest value is improving; “Yellow,” as it’s commonly understood, denotes caution because the variable may be changing direction; “Red” indicates that the variable in question is declining, both in its current value and in relation to the recent past.
Note that all the data, except for “mortgage rate” and “appliance-store sales” are seasonally adjusted and are represented at annual rates.
Remodeling Expenditures. This is the amount of money spent on home improvement projects during the month in question. It covers all work done for privately owned homes (excludes rentals, etc.). The data are in billions of dollars and are issued monthly by the U.S. Department of Commerce.
Single-Family Starts. This is the number of single-family houses for which construction was started in the given month. The data are in thousands of houses and are issued monthly by the U.S. Department of Commerce.
Existing-Home Sales. These data are issued monthly by the National Association of Realtors and capture the number of existing homes that were sold in the previous month.
High-End Home Sales. This series are sales of new homes priced at $500,000 and higher. The data are released quarterly by the U.S. Department of Commerce and are not seasonally adjusted. Thus, a valid comparison is made to the same quarter of prior year.
Mortgage Rate. We have chosen the rate on 30-year conventional loans that is issued by the Federal Home Loan Mortgage Corporation (known popularly as Freddie Mac.) Although there are a large number of mortgage instruments available to consumers, this one is still the most commonly used.
Employees in Residential Remodeling. This indicator denotes the number of individuals employed in construction firms that do mostly residential remodeling work.
Building-Materials Sales. These data, released monthly by the Department of Commerce, capture total sales of building materials, regardless of whether consumers or contractors purchased them. However, we should caution that the data also includes sales to projects other than residential houses.
Appliance-Store Sales.This driver captures the monthly sales of stores that sell mostly household appliances; the data are stated at an annual rate. We should not confuse this driver with total appliance sales, since they are sold by other types of stores such as home centers.
We hope you find this dashboard useful as a general guide to the state of our industry. Please contact us if you would like to see further detail.


