

More Economic Data Is Released in Wake of Shutdown
As Federal government agencies continue to catch up and release the backlog of economic data accumulated during the shutdown, a more accurate picture of the U.S. economy is emerging little by little.
Although stock market news has been available on a daily basis, it should be noted that stock market prices are not always a reliable indicator of general economic conditions. The aphorism about the stock market famously stated a few years back by Paul Samuelson, who won the Nobel Prize in economics, seems apt: He said the stock market has predicted nine out of the last five recessions.
Perhaps a more reliable indicator of economic conditions is the volume of manufacturing shipments — and the last couple of months’ data suggest a softening of activity in this sector. In fact, after a steady run since early 2016, when manufacturing shipments increased virtually every month, we saw the first declines in October and November of last year. They fell by 0.1% in October, and 0.6% in November.
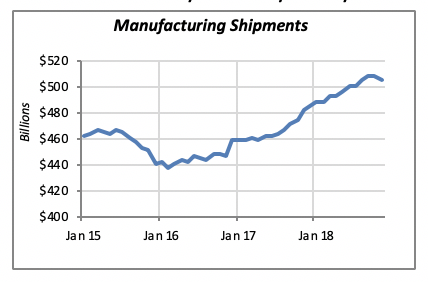
But despite these declines, shipments are still running 4.5% ahead of 2017.
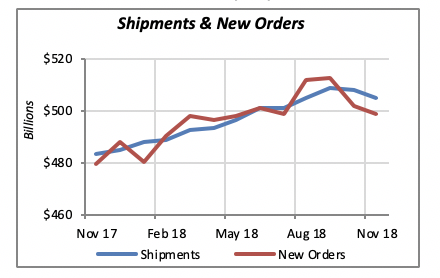
Another barometer of the state of the manufacturing sector is new orders. They obviously reflect future manufacturing activity and, consequently, future shipments. New orders for manufactured goods have also fallen in the last two months, although more sharply than shipments. While shipments have dropped just under 1 percent, new orders are down nearly 3 percent.
Remodeling Market: Declining but Still Positive
Overall employment in remodeling companies remains robust, but these companies serve both residential and commercial projects. The picture for the residential market alone is less favorable. In fact, as the chart below shows, expenditures by homeowners for remodeling their homes have been declining the last few months.
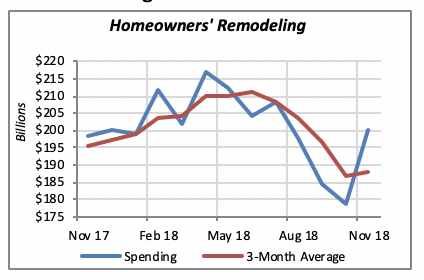
It is important to note, however, that the residential remodeling data only reflects activity through November of last year. A more recent perspective on the state of the industry is available through NAHB’s Remodeling Market Index, which captures remodelers’ and builders’ views on the remodeling market in their geographic areas.
This index, similar to other indices such as the Institute of Supply Managers’ PMI index, is normally taken to indicate an expanding market if the index value is above 50. Conversely, if the value is below 50, it indicates a contracting market. The dividing mark is indicated by the red line in the chart below.
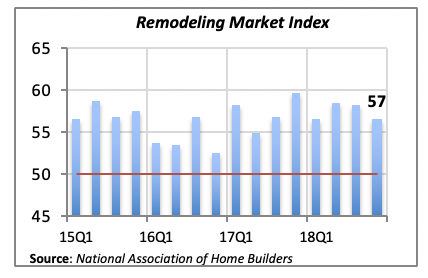
The latest value of the index, for the last quarter of 2018, is 57 — above the magical value of 50. However, as can be seen in the graph, for all practical purposes, the value has been declining since reaching a high point of 60 in the fourth quarter of 2017.
Mortgage Rates Continue to Slip
Last week, interest rates continued to decline. The 30-year fixed mortgage rate dropped by another 5 basis points to 4.41%. It’s been nearly a year since we’ve seen mortgage rates this low.
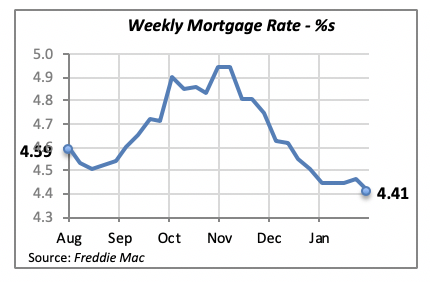
And, as noted last week, the Fed’s current policy is not to intervene aggressively in the credit markets. This simply means that pressures for interest rates to rise won’t originate from monetary policies. In fact, in the near term, mortgage and interest rates are expected to remain flat or trend lower.
Manuel Gutierrez, Consulting Economist to NKBA
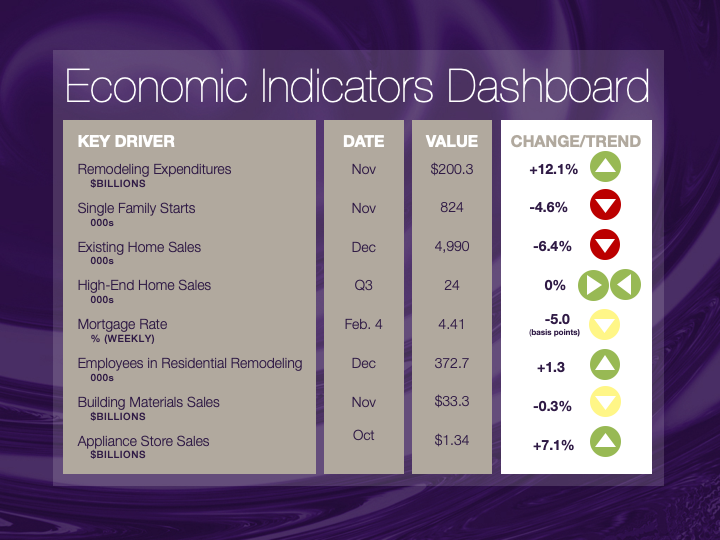
Explanation of NKBA’s Economic Indicators Dashboard
The dashboard displays the latest value of each economic indicator with a colored triangle that highlights visually the recent trend for each of the drivers. “Green” is a positive signal, indicating that the latest value is improving; “Yellow,” as it’s commonly understood, denotes caution because the variable may be changing direction; “Red” indicates that the variable in question is declining, both in its current value and in relation to the recent past.
Note that all the data, except for “mortgage rate” and “appliance-store sales” are seasonally adjusted and are represented at annual rates.
Remodeling Expenditures. This is the amount of money spent on home improvement projects during the month in question. It covers all work done for privately owned homes (excludes rentals, etc.). The data are in billions of dollars and are issued monthly by the U.S. Department of Commerce.
Single-Family Starts. This is the number of single-family houses for which construction was started in the given month. The data are in thousands of houses and are issued monthly by the U.S. Department of Commerce.
Existing-Home Sales. These data are issued monthly by the National Association of Realtors and capture the number of existing homes that were sold in the previous month.
High-End Home Sales. This series are sales of new homes priced at $500,000 and higher. The data are released quarterly by the U.S. Department of Commerce and are not seasonally adjusted. Thus, a valid comparison is made to the same quarter of prior year.
Mortgage Rate. We have chosen the rate on 30-year conventional loans that is issued by the Federal Home Loan Mortgage Corporation (known popularly as Freddie Mac.) Although there are a large number of mortgage instruments available to consumers, this one is still the most commonly used.
Employees in Residential Remodeling. This indicator denotes the number of individuals employed in construction firms that do mostly residential remodeling work.
Building-Materials Sales. These data, released monthly by the Department of Commerce, capture total sales of building materials, regardless of whether consumers or contractors purchased them. However, we should caution that the data also includes sales to projects other than residential houses.
Appliance-Store Sales.This driver captures the monthly sales of stores that sell mostly household appliances; the data are stated at an annual rate. We should not confuse this driver with total appliance sales, since they are sold by other types of stores such as home centers.
We hope you find this dashboard useful as a general guide to the state of our industry. Please contact us if you would like to see further detail.


