

Economic Indicators Reports Thwarted by Shutdown
Unfortunately, it has not been possible to update the economic indicators dashboard, owing to the disruption created by the federal government shutdown. Much of the data used to compile the indicators originates from federal government agencies, such as the Department of Commerce.
Variables used in the dashboard, such as single-family housing starts, are very important in the remodeling industry, and are reliable guides for NKBA businesses that are active in this sector. These variables are publicly available and are easily accessible to any of our members. Such would not be the case if the data collected was generated by private entities which, aside from issues related to “privacy,” would not be available for the general public (i.e., NKBA members) to consult.
Until the stalemate between the executive and legislative branches of government is resolved, this column will explore other data points.
Homeownership Among Millennials Improves
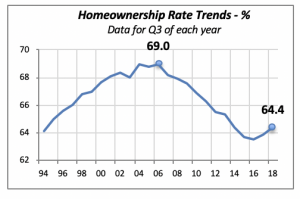
An issue of concern to businesses in the construction industry is the direction of the homeownership rate. This is simply because homeowners, who generally live in larger spaces than renters, tend to spend more on the maintenance and upgrade of their residences. Thus, it’s important to monitor movements in the rate of homeownership.
The the 2007-09 recession had a huge impact on homeownership, owing to the millions of households that lost their homes to foreclosure because of their inability to keep up with their mortgage payments. The 5.5% drop in homeownership, from the peak of 69% in 2006 to the low of 63.5% in 2016, resulted in the loss of 3.5 to 4 million homeowners.
But since that 2016 low point, the rate has improved by nearly 1% to 64.4%, even though it is still a long way from the high homeownership rate or 69% pre-recession.
Although we do not have precise data on homeownership among Millennials, strictly defined as those aged between 22 and 37 years old in 2018, we can approximate their number by looking at data for households owned by persons younger than 35. The chart below displays the 24-year homeownership trend for the under-35 crowd, during which period the rate fell by 9.3 points from 43.1% in 2004 to a low of 35.2% in 2016.
Over the last two years the Millennial homeownership rate has improved to 36.8%, but it’s still 6.3 percentage points below its 2004 peak.
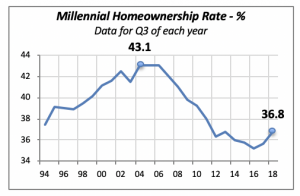
Recent research by the Federal Reserve bank suggests that 2% of the 9-point loss in homeownership rate between 2004 and 2014 is tied directly to student debt (the Fed data is based upon a different survey; thus, its numbers do not match the ones used here, but the direction is similar). Despite this research, there is no hard data from other sources confirming this, but the high levels of increasing student debt suggest that it will continue to prevent a full recovery in homeownership.
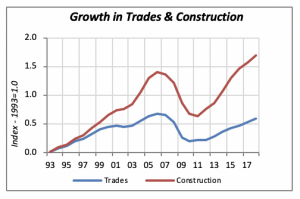
Trade Specialties
The construction industry depends on a large number of workers with a variety of technical expertise, unlike many other industries. Workers with all those types of expertise are usually grouped under a general category of “trade specialties,” which range from highly technical and skilled disciplines like electricians, to others with fewer requirements, such as drywall installers or individuals involved in site preparation.
In total, there are over 4.76 million workers in the specialty trades, with about 60% involved in construction. Naturally, their number fluctuates, depending on the level of construction activity, particularly in periods when demand for buildings or houses are rising or falling.
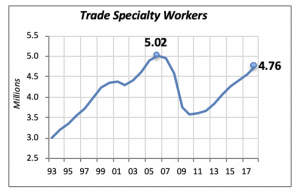
A surprising development is that the growth in employment among the trade specialties has not kept up with the overall growth in construction. Total construction, both residential and non-residential, has increased 169% over the last 25 years. But growth in employment in the specialty trades has increased by just 59% during the same period.
The different growth rates are partly explained by changes in the types of construction. For instance, if the rate of non-residential building construction increases more or less than that of residential construction, the types of trades being demanded by either category would drive a different growth rate.
A more definite answer can only be obtained by a detailed evaluation of the shifts among construction types over time.
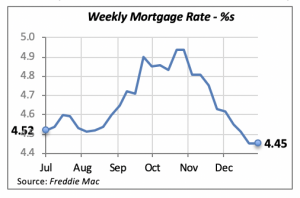
Mortgage Rates Remain Unchanged
Last week the 30-year, fixed mortgage rate remained unchanged at 4.45%. The direction that mortgage rates may take over the next few weeks will likely be influenced by the government shutdown.
The Federal government is a huge participant in the financial markets via its need to continuously refinance the existing $21 trillion debt. Since the government is, for all practical purposes, not incurring additional principal debt while the shutdown is in effect, the status quo is not altered significantly. That is, we do not see additional borrowing from the Federal government that would push interest rates higher.
However, the situation may change when the impasse breaks, and the government begins again to borrow additional funds to meet its spending needs. But for now, we should not expect big changes in mortgage rates.
Manuel Gutierrez, Consulting Economist to NKBA
Explanation of NKBA’s Economic Indicators Dashboard
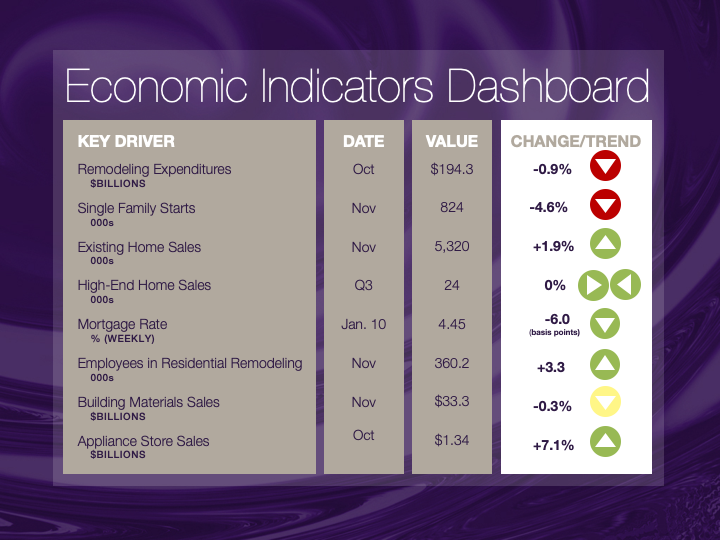
The dashboard displays the latest value of each economic indicator with a colored triangle that highlights visually the recent trend for each of the drivers. “Green” is a positive signal, indicating that the latest value is improving; “Yellow,” as it’s commonly understood, denotes caution because the variable may be changing direction; “Red” indicates that the variable in question is declining, both in its current value and in relation to the recent past.
Note that all the data, except for “mortgage rate” and “appliance-store sales” are seasonally adjusted and are represented at annual rates.
Remodeling Expenditures. This is the amount of money spent on home improvement projects during the month in question. It covers all work done for privately owned homes (excludes rentals, etc.). The data are in billions of dollars and are issued monthly by the U.S. Department of Commerce.
Single-Family Starts. This is the number of single-family houses for which construction was started in the given month. The data are in thousands of houses and are issued monthly by the U.S. Department of Commerce.
Existing-Home Sales. These data are issued monthly by the National Association of Realtors and capture the number of existing homes that were sold in the previous month.
High-End Home Sales. This series are sales of new homes priced at $500,000 and higher. The data are released quarterly by the U.S. Department of Commerce and are not seasonally adjusted. Thus, a valid comparison is made to the same quarter of prior year.
Mortgage Rate. We have chosen the rate on 30-year conventional loans that is issued by the Federal Home Loan Mortgage Corporation (known popularly as Freddie Mac.) Although there are a large number of mortgage instruments available to consumers, this one is still the most commonly used.
Employees in Residential Remodeling. This indicator denotes the number of individuals employed in construction firms that do mostly residential remodeling work.
Building-Materials Sales. These data, released monthly by the Department of Commerce, capture total sales of building materials, regardless of whether consumers or contractors purchased them. However, we should caution that the data also includes sales to projects other than residential houses.
Appliance-Store Sales.This driver captures the monthly sales of stores that sell mostly household appliances; the data are stated at an annual rate. We should not confuse this driver with total appliance sales, since they are sold by other types of stores such as home centers.
We hope you find this dashboard useful as a general guide to the state of our industry. Please contact us if you would like to see further detail.


