

Women in Construction Trades
A few months ago, NKBA touched briefly on women’s share of jobs in several areas within and related to construction and remodeling. At that time, women’s share of jobs was highest among interior designers (73%), while in construction overall, women’s share was only 12%. And, in fact, the female share in specialty trades is even lower, at just 10% of all these jobs taken by women.
Following is a snapshot of the share of women’s jobs in specialty trades compared to the average wages in those trades. The percentage of women in construction-related fields has remained fairly stable in the past 30 years. Note that this does not show whether women are earning more or less than men. This is because the earnings data is the average of all workers in each trade specialty area, which includes earnings of both men and women.
First is a look at all major industry sectors (chart below). The chart displays the average hourly wage of workers along the vertical axis, and the ratio of women workers to all workers along the horizontal axis.
The red dot indicates the average for all workers in the private sector. Curiously, the government does not publish this data for government employees. The average hourly wage in the private sector was just under $24 at the end of last year, with women making up just under half of the workforce (48%).

At the extreme right of the chart are two industries, Health Care and Social Assistance, where females make up around 80% of the corresponding workforce — the highest among all industries. Reading up and down, there is a huge difference in their wages. In fact, people working in Health Caremake twice as much per hour, on average, that those in Social Assistance. It’s safe to surmise that this difference in wages is driven by the education and training requirements of health care compared to social assistance, as well as greater demand for workers in health-care fields.
One thing evident from a visual inspection of the chart, which can be corroborated statistically, is that there is virtually no correlation between average hourly wages and the percent of women in industries. Looking at any wage range — for instance, between $25 and $30 — and the percentage of women working varies from a low of 13% in construction and mining, to a high of 80% in health care.
But what the chart clearly shows is that female workers are a lower presence in industries that may be more physically demanding, such as utilities, mining, construction, etc.
Moving to construction-related specialty trades, which overall have only 11% female workers, the sector employing the highest percentage of women is Flooring,with a 19% female workforce. Finish Carpentryhas the second-highest percentage, with 15% women.
Note also that both of these trades have wages below the overall hourly average of $29 for all specialty trades, shown by the dark blue dot in the chart.
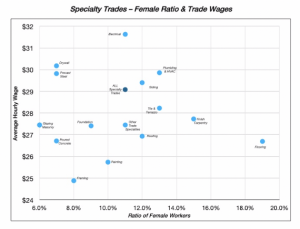
The two trades that typically require licensing, Electrical and Plumbing & HVAC, command the highest wages among all trades. Of these two, Plumbing & HVAChas a greater proportion of female workers — about 13% — compared to around 11% for Electrical.
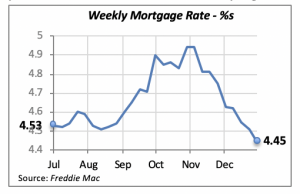
Mortgage Rates Drop Further —Is This a Good Sign?
While mortgage rates keep falling, partly as a consequence of weak housing demand, those falling rates are at the same time making home purchases more affordable. Last week, the 30-year, fixed mortgage rate fell by six basis points to 4.45%. This brings rates to half a percentage point lower than what it was exactly eight weeks ago: 4.94%
But whether lower rates would in fact persuade consumers that a home purchase is a good decision at this time remains to be seen. A recent survey by Fannie Mae revealed that “consumer attitudes regarding whether it’s a good time to buy a home worsened significantly in the last month.” This negative trend has been evident for the last three or four months, coinciding more or less with the increases in mortgage rates that began in late August of last year. Click to read more on the Fannie Mae survey.
Manuel Gutierrez, Consulting Economist to NKBA
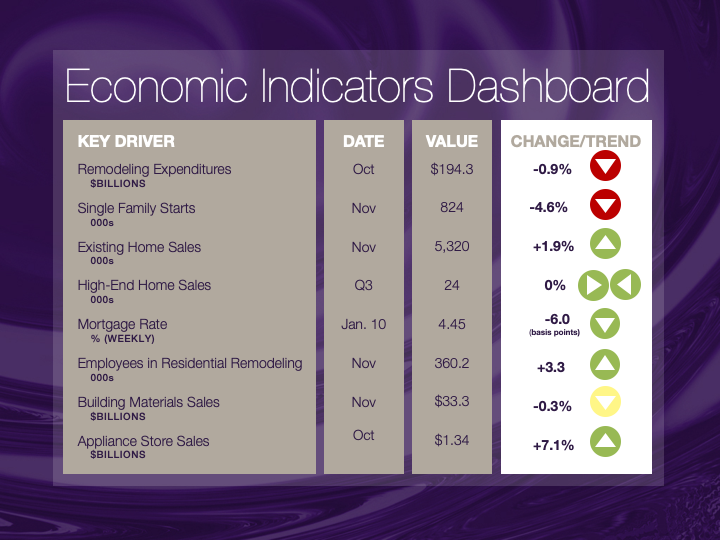
Explanation of NKBA’s Economic Indicators Dashboard
The dashboard displays the latest value of each economic indicator with a colored triangle that highlights visually the recent trend for each of the drivers. “Green” is a positive signal, indicating that the latest value is improving; “Yellow,” as it’s commonly understood, denotes caution because the variable may be changing direction; “Red” indicates that the variable in question is declining, both in its current value and in relation to the recent past.
Note that all the data, except for “mortgage rate” and “appliance-store sales” are seasonally adjusted and are represented at annual rates.
Remodeling Expenditures. This is the amount of money spent on home improvement projects during the month in question. It covers all work done for privately owned homes (excludes rentals, etc.). The data are in billions of dollars and are issued monthly by the U.S. Department of Commerce.
Single-Family Starts. This is the number of single-family houses for which construction was started in the given month. The data are in thousands of houses and are issued monthly by the U.S. Department of Commerce.
Existing-Home Sales. These data are issued monthly by the National Association of Realtors and capture the number of existing homes that were sold in the previous month.
High-End Home Sales. This series are sales of new homes priced at $500,000 and higher. The data are released quarterly by the U.S. Department of Commerce and are not seasonally adjusted. Thus, a valid comparison is made to the same quarter of prior year.
Mortgage Rate. We have chosen the rate on 30-year conventional loans that is issued by the Federal Home Loan Mortgage Corporation (known popularly as Freddie Mac.) Although there are a large number of mortgage instruments available to consumers, this one is still the most commonly used.
Employees in Residential Remodeling. This indicator denotes the number of individuals employed in construction firms that do mostly residential remodeling work.
Building-Materials Sales. These data, released monthly by the Department of Commerce, capture total sales of building materials, regardless of whether consumers or contractors purchased them. However, we should caution that the data also includes sales to projects other than residential houses.
Appliance-Store Sales.This driver captures the monthly sales of stores that sell mostly household appliances; the data are stated at an annual rate. We should not confuse this driver with total appliance sales, since they are sold by other types of stores such as home centers.
We hope you find this dashboard useful as a general guide to the state of our industry. Please contact us if you would like to see further detail.


