

Housing Affordability Improves
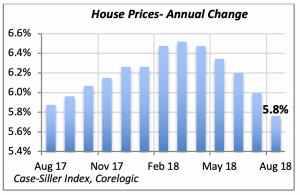
Even though home prices are still rising at a respectable clip — they were 5.8% higher in August than the same month last year — their rate of increase has moderated the last few months. House prices reached a peak in March, when they were rising at a pace of 6.4%.
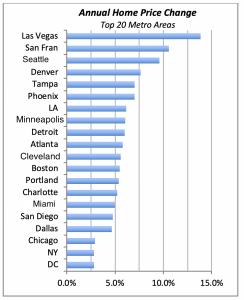
As would be expected, there are significant differences in the rate of home-price appreciation among the nation’s metropolitan areas. The high is seen in Las Vegas, where prices in August were nearly 14% higher than a year ago. This is a dramatic swing from 10 years ago, when Las Vegas was at the epicenter of the housing foreclosure debacle.
Other cities with fast-rising prices are San Francisco with a 10.6% increase, a perennial situation in a city of that is well-known for its many housing restrictions. Seattle’s rate of appreciation is 9.6%, while Denver clocks in at 7.7%.
The chart below displays the change in prices over the 12 months ended in August 2018, for the top 20 metro areas.
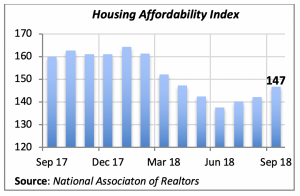
On a national basis, however, the home price moderation has resulted in improvements in housing affordability. The affordability index has been improving the last few months, since it reached a low of 137.7 in June. The index compares average household income, i.e. median household income, to the median home price. When both of these are equal, the index value is 100. So the current value of 147 is very favorable toward house purchases.
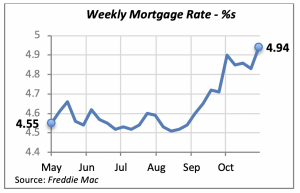
Mortgage Rates Spike
After three weeks of moderation in mortgage rates, they shot up by 11 basis points last week to reach their highest point in nearly eight years. We have to look back to January 2011 to see rates this high.
This jump is not totally unexpected, despite the weakened demand for housing. The Fed’s decision to leave the fed funds rate unchanged last week does not change the trend toward higher interest rates. The Federal Reserve Bank had forced this rate to stay at virtually zero between 2009 and 2015, when the bank changed course and began a gradual tightening. The fed funds rate stands today between 2% and 2.25%.
Like other types of interest rates, mortgage rates have responded accordingly, following a similar upward movement. And the most recent increase will put further pressures in the new housing market. Housing construction and home sales have softened over the last few months. In fact, housing starts in the three quarters ended in September averaged a rate of 1.18 million units, a 3% drop from the previous 12 months’ average.
Similarly, sales of existing homes in the latest quarter are running at a pace that is 5% lower than the prior year’s average.
Manuel Gutierrez, Consulting Economist to NKBA
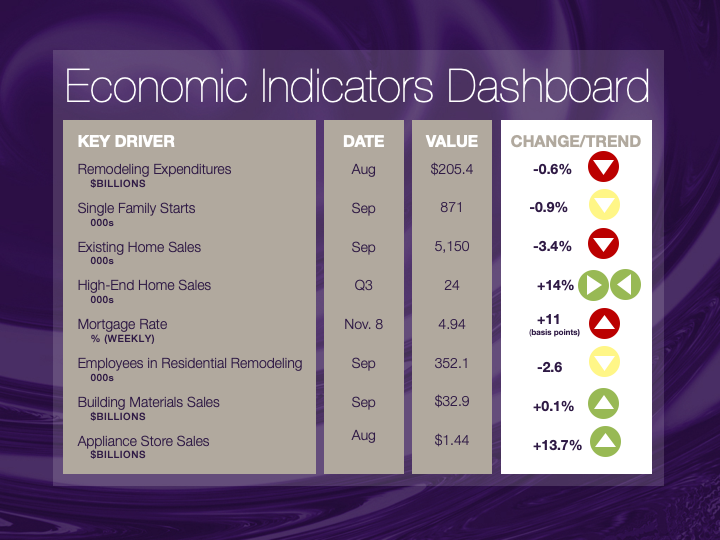
Explanation of NKBA’s Economic Indicators Dashboard
The dashboard displays the latest value of each economic indicator with a colored triangle that highlights visually the recent trend for each of the drivers. “Green” is a positive signal, indicating that the latest value is improving; “Yellow,” as it’s commonly understood, denotes caution because the variable may be changing direction; “Red” indicates that the variable in question is declining, both in its current value and in relation to the recent past.
Note that all the data, except for “mortgage rate” and “appliance-store sales” are seasonally adjusted and are represented at annual rates.
Remodeling Expenditures. This is the amount of money spent on home improvement projects during the month in question. It covers all work done for privately owned homes (excludes rentals, etc.). The data are in billions of dollars and are issued monthly by the U.S. Department of Commerce.
Single-Family Starts. This is the number of single-family houses for which construction was started in the given month. The data are in thousands of houses and are issued monthly by the U.S. Department of Commerce.
Existing-Home Sales. These data are issued monthly by the National Association of Realtors and capture the number of existing homes that were sold in the previous month.
High-End Home Sales. This series are sales of new homes priced at $500,000 and higher. The data are released quarterly by the U.S. Department of Commerce and are not seasonally adjusted. Thus, a valid comparison is made to the same quarter of prior year.
Mortgage Rate. We have chosen the rate on 30-year conventional loans that is issued by the Federal Home Loan Mortgage Corporation (known popularly as Freddie Mac.) Although there are a large number of mortgage instruments available to consumers, this one is still the most commonly used.
Employees in Residential Remodeling. This indicator denotes the number of individuals employed in construction firms that do mostly residential remodeling work.
Building-Materials Sales. These data, released monthly by the Department of Commerce, capture total sales of building materials, regardless of whether consumers or contractors purchased them. However, we should caution that the data also includes sales to projects other than residential houses.
Appliance-Store Sales.This driver captures the monthly sales of stores that sell mostly household appliances; the data are stated at an annual rate. We should not confuse this driver with total appliance sales, since they are sold by other types of stores such as home centers.
We hope you find this dashboard useful as a general guide to the state of our industry. Please contact us if you would like to see further detail.


