

More Homeowners, Fewer Remodeling Jobs
As is often the case, last week’s economic news was mixed.
On the plus side:
- More households became homeowners in the third quarter.
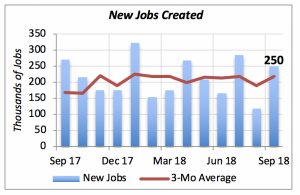
- S. employment rose by 250,000 workers in October.
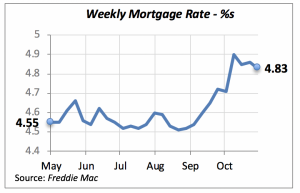
- Mortgage rates fell slightly, making homes more affordable.
But, closer to our industry, some negative news:
- The number of workers in the remodeling industry fell by 2,600.
- The rate of spending for remodeling by homeowners also fell, by 0.6%.
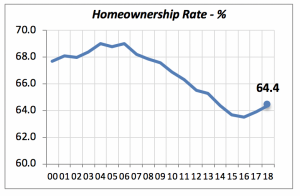
Homeownership Rises
American homeownership rates increased in the third quarter. Currently, 64.4% of the households reside in their own homes, reflecting gains achieved since the second quarter 2016, when the rate reached its lowest point. That’s when the market started to rebound. The gain over the last four quarters is half a point.
Among the various ethnic groups, blacks have the lowest rate of homeownership — just over four in ten households headed by a black person own their home. Hispanic ownership is slightly better, but still under half of Hispanic-headed households own their home.
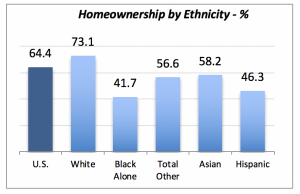
Even though all ethnic groups have posted gains in homeownership over the last two years, those gains are not equal. The biggest improvement is among Asians, who saw their ownership rate jump by 2.5 percentage points, while blacks had the smallest improvement with 0.2%.
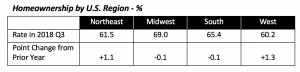
As expected, there are wide differences in homeownership among the four geographic regions. The highest rate is in the Midwest, topping 69% in the third quarter. This is nearly 10 points highest than that of the West region, which posts 60.2% of households owning their homes. The Northeast is slightly higher than the West, with 61.5% homeownership rate, and the South weighs in at 65.4%.
Job Growth Continues
Despite the difficulty that many firms face in finding workers, last week, private businesses added 246,000 workers, which, combined with another 4,000 added by the various levels of government brings to 250,000 the number of jobs added in October. Since October 2017, the U.S. economy has seen its employment grow by 2.5 million jobs. The vast majority of those jobs originate in the private sector, which has added 2.45 million jobs during the last 12 months.
At the same time, the unemployment rate remained unchanged at 3.7%.
The pool of workers rose in October, too — the labor force participation rate rose to 62.9% in the month. Each month, around 300,000 baby boomers reach retirement age, with many of them leaving the labor force. But at the same time, young people and others join the work force. It is crucial for the U.S. economy to continue growing, so the number of those joining comfortably replaces those who leave.
There are two possible ways for an economy to grow. One is by achieving increases in productivity, i.e., by the same number of workers being able to produce more. This is very likely by utilizing more efficient machinery or tools. The second way is by adding more workers.
Mortgage Rates Edge Down
The latest data marks the third consecutive week of falling mortgage rates. Although the declines are modest, they have fallen only nine basis points in the past four weeks, when the rate was 4.9%. This trend reverses the sharp increases seen throughout September. Of course, this is good news for potential home buyers, as it makes a home purchase slightly more affordable.
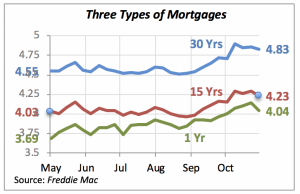
Typically, the focus is on the 30-year mortgage rate, which is still the one most commonly used. For general purposes, it is safe to focus on one rate, since mortgage rates of various terms (i.e., lengths of the loans) tend to move more or less in tandem. This is illustrated in the chart below, where we can see the 30-year fixed rate compared to both the 15-year fixed and the 1-year adjustable (or ARM).
Manuel Gutierrez, Consulting Economist to NKBA
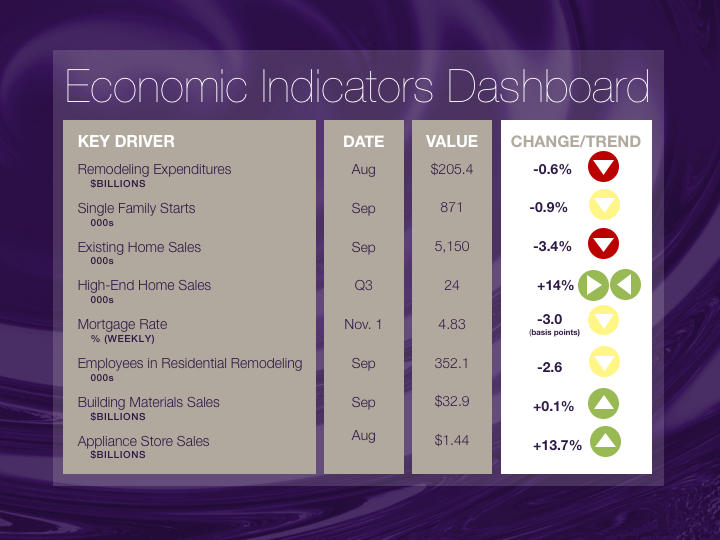
Explanation of NKBA’s Economic Indicators Dashboard
The dashboard displays the latest value of each economic indicator with a colored triangle that highlights visually the recent trend for each of the drivers. “Green” is a positive signal, indicating that the latest value is improving; “Yellow,” as it’s commonly understood, denotes caution because the variable may be changing direction; “Red” indicates that the variable in question is declining, both in its current value and in relation to the recent past.
Note that all the data, except for “mortgage rate” and “appliance-store sales” are seasonally adjusted and are represented at annual rates.
Remodeling Expenditures. This is the amount of money spent on home improvement projects during the month in question. It covers all work done for privately owned homes (excludes rentals, etc.). The data are in billions of dollars and are issued monthly by the U.S. Department of Commerce.
Single-Family Starts. This is the number of single-family houses for which construction was started in the given month. The data are in thousands of houses and are issued monthly by the U.S. Department of Commerce.
Existing-Home Sales. These data are issued monthly by the National Association of Realtors and capture the number of existing homes that were sold in the previous month.
High-End Home Sales. This series are sales of new homes priced at $500,000 and higher. The data are released quarterly by the U.S. Department of Commerce and are not seasonally adjusted. Thus, a valid comparison is made to the same quarter of prior year.
Mortgage Rate. We have chosen the rate on 30-year conventional loans that is issued by the Federal Home Loan Mortgage Corporation (known popularly as Freddie Mac.) Although there are a large number of mortgage instruments available to consumers, this one is still the most commonly used.
Employees in Residential Remodeling. This indicator denotes the number of individuals employed in construction firms that do mostly residential remodeling work.
Building-Materials Sales. These data, released monthly by the Department of Commerce, capture total sales of building materials, regardless of whether consumers or contractors purchased them. However, we should caution that the data also includes sales to projects other than residential houses.
Appliance-Store Sales.This driver captures the monthly sales of stores that sell mostly household appliances; the data are stated at an annual rate. We should not confuse this driver with total appliance sales, since they are sold by other types of stores such as home centers.
We hope you find this dashboard useful as a general guide to the state of our industry. Please contact us if you would like to see further detail.


