

Housing Market in Freefall
Homes are more essential than ever, but recent data on the housing market confirms that housing transactions are crashing. Last week, two key indicators of the new housing market paint a grim picture: one is on construction of new houses, and the other is a survey of home builders.
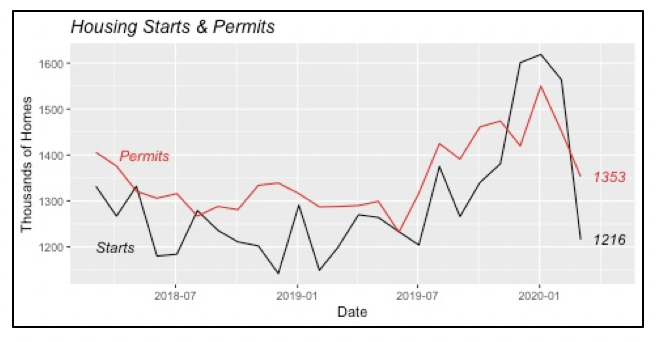
Even though the “stay at home” mandate was fully operational only during the second half of March, housing starts fell by 22% in the month to an annualized rate of 1.22 million units, for the third-highest percentage drop since 1959, when the government began first to gather this data on a regular basis. Total housing starts turned down dramatically as well, after three months of heavy activity, when new housing construction was running at a rate of 1.6 million units annually.
The nice run-up in housing activity seen since the beginning of last year ended abruptly last month. And further declines are expected this month, given the near paralysis of economic activity throughout the nation in April. New housing activity in March was down to levels of a year ago.
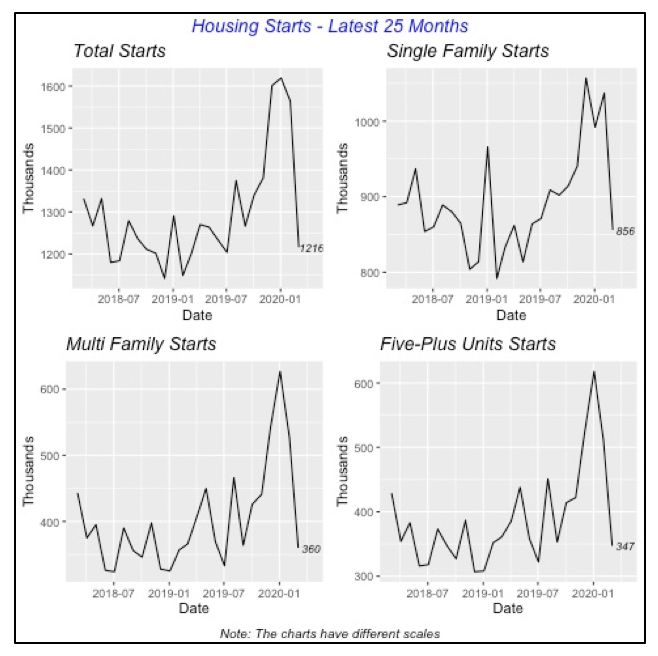
Naturally, this same pattern is repeated for single-family and multifamily housing starts. Construction of single-family houses fell by 17.5% in March, down to an annual rate of 856,000 units, also to levels matching those of a year ago, as illustrated in graph below.
Multifamily housing construction fell by a larger magnitude, dropping 32% to a rate of just 360,000 units. Multifamily housing data combines two types of housing units; one is buildings with at least five housing units, which last month amounted to 347,000 units (annual rate). The other type is housing units in buildings that contain two to four housing units. The vast majority of multifamily buildings have at least five units, historically nine of 10 multifamily houses are in buildings with five units or more.
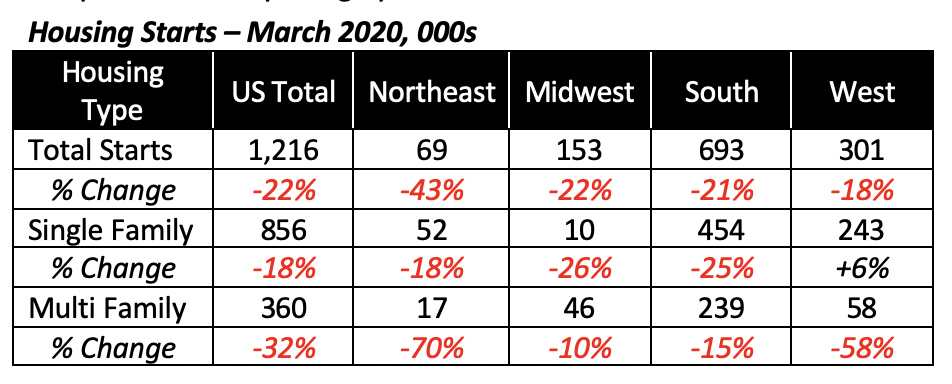
Regionally, the collapse of housing construction was evident across the four U.S. zones and house types, the only one exception is the West, which inexplicably saw single-family starts actually rising by 6%.
Builder Sentiment Plummets
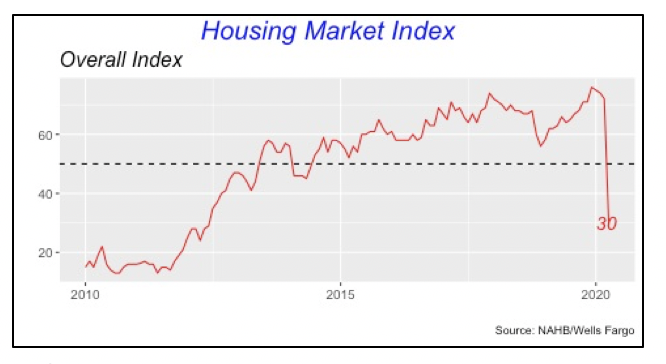
A monthly survey of builders’ opinions, taken jointly by the National Association of Home Builders and Wells-Fargo bank, reveals that the index fell by 42 points this month, a historically large drop, to a value of 30 — the lowest value in six years. Further, and more significant, is the fact that the value is below 50, which indicates that the proportion of negative opinions exceeds favorable ones, and which clearly confirms that the market is contracting.
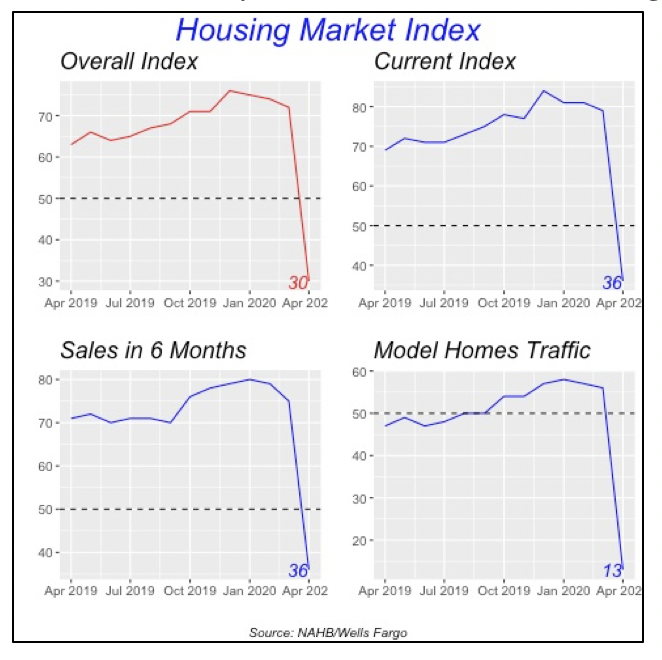
Index Components
Not surprisingly, the index’s three components also fell by similar magnitudes, although the one that measures traffic in model homes fell the farthest. These are clearly the results of the “stay at home” and “social distancing” mandates.
Unemployment Claims Remain High
Last week saw another huge number of applications for unemployment benefits. Although at 5.25 million, it was smaller than 6.7 million average for the previous two weeks, it is still an astonishingly high figure.
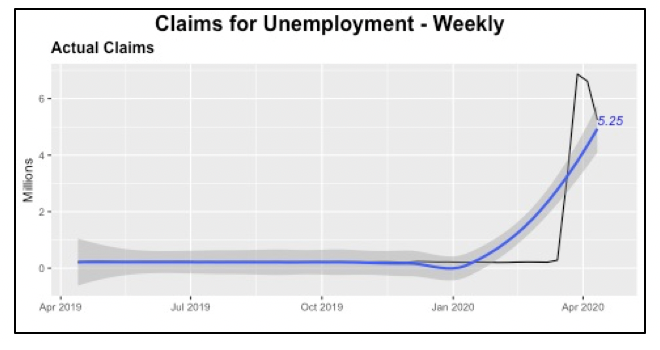
So far over the last four weeks, 22 million people have applied for unemployment benefits. There are additional countless individuals who have been put on “reduced hours” down to zero and who, therefore, are prevented from applying for unemployment.
Adding 22 million to the 7.1 million who were already unemployed at the end of February reveals that there are at least 29 million people currently unemployed in the U.S. This results in an unemployment rate that ranges around 16% to 18%, or almost one in five workers without a job.
Retail Sales
Retail sales in March plunged 8.7% from February, for the largest drop since 1992, when the Commerce Department began gathering these data. During the 2007-2009 recession, the last time retail sales fell dramatically, it took three months for sales to drop by the same magnitude as March’s decline.
But retail sales did not fall across all categories — there were a few exceptions where sales actually increased in March. Most significant was the spike at Food and Beverage stores, e.g., supermarkets and liquor stores, where they rose by more than 25% in the month. Sales at Food & Beverage stores typically account for 12% of all retail sales, but in March they jumped to 17% of the total.

Further, four other store types saw sales increases last month, seen in the charts above by the rising trend lines. They are Internet & Mail Order outlets, which account for 14% of total sales; General Merchandisestores, accounting for 13% of sales; Building Materials stores, 7%, and Health stores, with 6% of total sales.
Altogether, categories with increased sales represented 58% of sales in March. However, except for the sales increase in Food & Beverage stores, the gains in the other three store categories were in the low-single-digits.
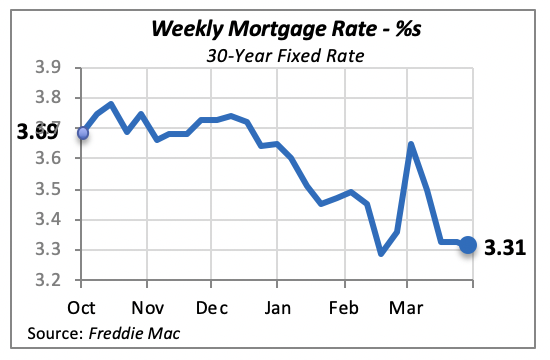
Modest Drop in Mortgage Rates
Although mortgage rates changed minimally last week, the low rates have induced many consumers to refinance their mortgages. Projections from the Mortgage Bankers Association suggest an extremely robust 31% increase in the volume of mortgage refinances this year compared to 2019.
The Association projects that mortgage refinances will reach $1.18 trillion this year, up from $901 billion in 2019. Further, these projections were issued early in April, when the prospect of a closed economy was clearly under way.
Manuel Gutierrez, Consulting Economist to NKBA
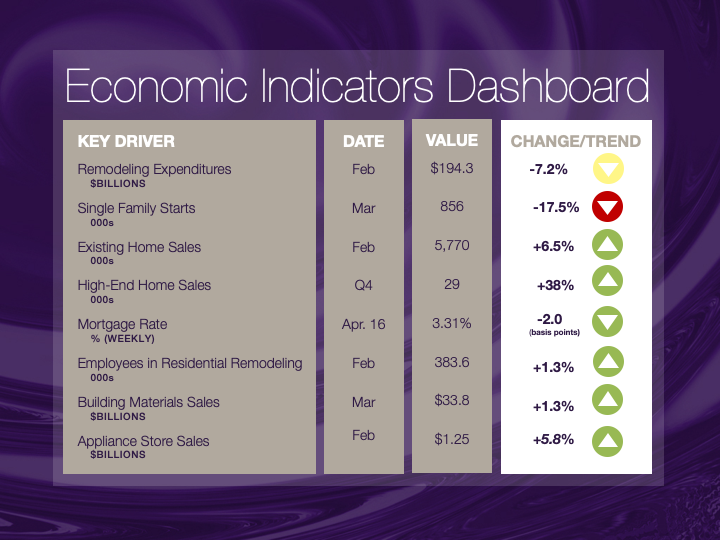
Explanation of NKBA’s Economic Indicators Dashboard
The dashboard displays the latest value of each economic indicator with a colored triangle that highlights visually the recent trend for each of the drivers. “Green” is a positive signal, indicating that the latest value is improving; “Yellow,” as it’s commonly understood, denotes caution because the variable may be changing direction; “Red” indicates that the variable in question is declining, both in its current value and in relation to the recent past.
Note that all the data, except for “mortgage rate” and “appliance-store sales” are seasonally adjusted and are represented at annual rates.
Remodeling Expenditures. This is the amount of money spent on home improvement projects during the month in question. It covers all work done for privately owned homes (excludes rentals, etc.). The data are in billions of dollars and are issued monthly by the U.S. Department of Commerce.
Single-Family Starts. This is the number of single-family houses for which construction was started in the given month. The data are in thousands of houses and are issued monthly by the U.S. Department of Commerce.
Existing-Home Sales. These data are issued monthly by the National Association of Realtors and capture the number of existing homes that were sold in the previous month.
High-End Home Sales. This series are sales of new homes priced at $500,000 and higher. The data are released quarterly by the U.S. Department of Commerce and are not seasonally adjusted. Thus, a valid comparison is made to the same quarter of prior year.
Mortgage Rate. We have chosen the rate on 30-year conventional loans that is issued by the Federal Home Loan Mortgage Corporation (known popularly as Freddie Mac.) Although there are a large number of mortgage instruments available to consumers, this one is still the most commonly used.
Employees in Residential Remodeling. This indicator denotes the number of individuals employed in construction firms that do mostly residential remodeling work.
Building-Materials Sales. These data, released monthly by the Department of Commerce, capture total sales of building materials, regardless of whether consumers or contractors purchased them. However, we should caution that the data also includes sales to projects other than residential houses.
Appliance-Store Sales. This driver captures the monthly sales of stores that sell mostly household appliances; the data are stated at an annual rate. We should not confuse this driver with total appliance sales, since they are sold by other types of stores such as home centers.
We hope you find this dashboard useful as a general guide to the state of our industry. Please contact us at Feedback@nkba.org if you would like to see further detail.


